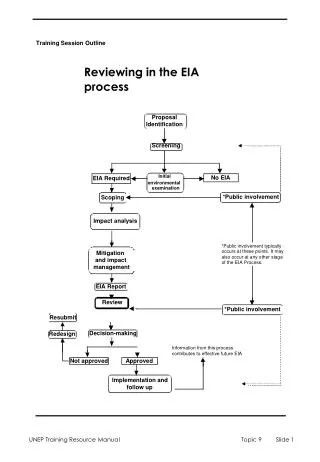
Analyzing U.S. Energy Production Trends
270 likes | 289 Vues
Explore insights on drilling productivity and production trends, including factors affecting new and existing well output to maintain increasing energy production. Learn from historical data on rig counts and natural gas production dynamics.

Analyzing U.S. Energy Production Trends
E N D
Presentation Transcript
EIA Drilling Productivity Report For Center on Global Energy Policy, Columbia University October 29, 2013 | New York, NY By Adam Sieminski, Administrator
The U.S. has experienced a rapid increase in natural gas and oil production from shale and other tight resources shale and tight oil production million barrels per day dry shale gas production billion cubic feet per day Note: Dry shale gas production data are based on LCI Energy Insight gross withdrawal estimates as of June 2013, converted to dry production estimates with EIA-calculated average gross-to-dry shrinkage factors by state and/or shale play. Source: EIA based on DrillingInfo and LCI Energy Insight Adam Sieminski, EIA Drilling Productivity Report October 29, 2013
Key insights on drilling productivity and production trends • Higher drilling efficiency and new well productivity, rather than an increase in the rig count, have been the main drivers of recent production growth • In the six plays considered, steep legacy production decline rates offset new well production by 69% for oil and 73% for natural gas • Understanding the positive and negative forces that affect production volumes in a given region allows the estimation of the number of rigs required to make up for the natural loss of production from existing wells • Considering new and existing wells separately helps to highlight plays where the growing number of relatively new wells leads to large monthly declines in legacy production, putting more pressure on increasing production from new wells in order to keep net output rising Adam Sieminski, EIA Drilling Productivity Report October 29, 2013
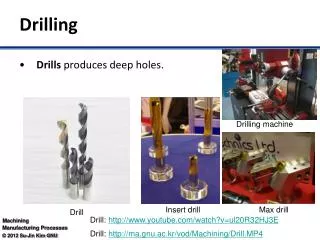
A little drilling history Adam Sieminski, EIA Drilling Productivity Report October 29, 2013
Rig counts and natural gas production appeared to be coupled during 2006 and 2007 rig count U.S. natural gas production billion cubic feet Source: Baker Hughes, Inc. rig count, EIA Short-Term Energy Outlook gas production natural gas rotary rigs Adam Sieminski, EIA Drilling Productivity Report October 29, 2013
Before 2006, changes in natural gas rig counts did not suggest subsequent changes in production rig count U.S. natural gas production billion cubic feet Source: Baker Hughes, Inc. rig count, EIA Short-Term Energy Outlook gas production natural gas rotary rigs Adam Sieminski, EIA Drilling Productivity Report October 29, 2013
Gas-directed rig counts no longer serve as a useful metric for natural gas production levels rig count U.S. natural gas production billion cubic feet Source: Baker Hughes, Inc. rig count, EIA Short-Term Energy Outlook gas production natural gas rotary rigs Adam Sieminski, EIA Drilling Productivity Report October 29, 2013
Rig counts, either gas-directed or total, no longer serve as a useful metric for natural gas production levels oil and natural gas rig count and natural gas production U.S. rig count billion cubic feet per day Source: Baker Hughes, Inc. rig count, EIA Short-Term Energy Outlook natural gas production Adam Sieminski, EIA Drilling Productivity Report October 29, 2013
Rig counts, either oil-directed or total, are no longer an adequate indicator for oil production, which has continued to rise in 2013 despite a leveling of rig counts rig count U.S. crude oil production million barrels per day Source: Baker Hughes, Inc. rig count, EIA Short-Term Energy Outlook oil production (right axis) Adam Sieminski, EIA Drilling Productivity Report October 29, 2013
Oil and natural gas are increasingly developed from the same wells share of new wells by type of hydrocarbons produced Source: EIA analysis of data from DrillingInfo, Inc. Adam Sieminski, EIA Drilling Productivity Report October 29, 2013
In 2011 and 2012, more than half of all new wells produced both oil and natural gas count of new wells by production type Source: EIA analysis of data from DrillingInfo, Inc. Adam Sieminski, EIA Drilling Productivity Report October 29, 2013
Natural gas producers adapt their formation in line with market value Eagle Ford new well gas/oil production ratio Mcf/bbl Source: EIA Drilling Productivity Report, EIA Short Term Energy Outlook natural gas price dollars per million Btu production ratio Mcf/bbl (left axis) Adam Sieminski, EIA Drilling Productivity Report October 29, 2013
EIA’s Drilling Productivity Report (DPR) uses a series of new metrics to assess the production and depletion trends of oil and natural gas wells • Rig count • Well classification • Drilling efficiency • Productivity of new wells • Production and depletion trends Adam Sieminski, EIA Drilling Productivity Report October 29, 2013
Drilling efficiency can be used to relate the number of rigs to production from new wells Eagle Ford drilling efficiency wells per rig per month Eagle Ford first full month’s production per well Mcf/day Bbl/day Source: EIA Drilling Productivity Report Adam Sieminski, EIA Drilling Productivity Report October 29, 2013
Six key plays account for nearly all recent growth in production Source: EIA Drilling Productivity Report Adam Sieminski, EIA Drilling Productivity Report October 29, 2013
DPR methodology • Monthly additions from one average rig • Represents EIA’s estimate of an average rig’s contribution to production of oil and natural gas from new wells • New-well oil/gas production per rig • Represents historical estimated monthly additions from one average rig coupled with the number of total drilling rigs as reported by Baker Hughes • Legacy oil and natural gas production change • Represents EIA’s estimates of total oil and gas production changes from all the wells other than the new wells; the trend is dominated by the well depletion rates • Projected change in monthly oil/gas production • Represents the combined effects of new-well production and changes to legacy production • Oil/gas production • Represents oil and natural gas production from both new and legacy wells since 2007, based on all wells reported to state oil and gas agencies Adam Sieminski, EIA Drilling Productivity Report October 29, 2013
Rigs needed to sustain production in the Eagle Ford play Eagle Ford rigs needed to sustain prior month’s production Source: EIA Drilling Productivity Report Adam Sieminski, EIA Drilling Productivity Report October 29, 2013
Rigs needed to sustain production in the Bakken play Bakken rigs needed to sustain prior month’s production Source: EIA Drilling Productivity Report Adam Sieminski, EIA Drilling Productivity Report October 29, 2013
DPR fills in missing data due to lags in state reporting oil production in 6 key plays million barrels per day May-13 Aug-13 Oct-13 Source: EIA analysis of Drillinginfo data Adam Sieminski, EIA Drilling Productivity Report October 29, 2013
Backup slides Adam Sieminski, EIA Drilling Productivity Report October 29, 2013
DPR Bakken page Adam Sieminski, EIA Drilling Productivity Report October 29, 2013
DPR methodology: step 1 – monthly additions from one rig Bakken Marcellus October 2013 drilling data through September, projected production through November Monthly additions from one average rig: Monthly additions from one average rig represent EIA’s estimate of an average rig’s contribution to production of oil and natural gas from new wells. The estimation of new-well production per rig uses several months of recent historical data on total production from new wells for each field divided by the region’s monthly rig count, lagged by two months. Current- and next-month values are listed on the top header. Source: EIA Drilling Productivity Report Adam Sieminski, EIA Drilling Productivity Report October 29, 2013
DPR methodology: step 2 – rig counts and production per rig New-well oil/gas production per rig: The charts present historical estimated monthly additions from one average rig coupled with the number of total drilling rigs reported by Baker Hughes. Source: EIA Drilling Productivity Report Adam Sieminski, EIA Drilling Productivity Report October 29, 2013
DPR methodology: step 3 – legacy production decline Monthly additions from one average rig: The charts present EIA’s estimates of total oil and gas production changes from all the wells other than the new wells. The trend is dominated by the well depletion rates, but other circumstances can influence the direction of the change. For example, well freeze-offs or hurricanes can cause production to significantly decline in any given month, resulting in a production increase the next month when production simply returns to normal levels. Source: EIA Drilling Productivity Report Adam Sieminski, EIA Drilling Productivity Report October 29, 2013
DPR methodology: step 4 – production change Monthly additions from one average rig: The charts present the combined effects of new-well production and changes to legacy production. Total new-well production is offset by the anticipated change in legacy production to derive the net change in production. The estimated change in production does not reflect external circumstances that can affect the actual rates, such as infrastructure constraints, bad weather, or shut-ins based on environmental or economic issues. Source: EIA Drilling Productivity Report Adam Sieminski, EIA Drilling Productivity Report October 29, 2013
DPR methodology: step 5 – total production Oil/gas production: These charts present oil and natural gas production from both new and legacy wells since 2007. This production is based on all wells reported to the state oil and gas agencies. Where state data are not immediately available, EIA estimates the production based on estimated changes in new-well oil/gas production and the corresponding legacy change. Source: EIA Drilling Productivity Report Adam Sieminski, EIA Drilling Productivity Report October 29, 2013
U.S. Energy Information Administration home page | www.eia.gov Drilling Productivity Report | http://www.eia.gov/petroleum/drilling Annual Energy Outlook | www.eia.gov/aeo Short-Term Energy Outlook | www.eia.gov/steo International Energy Outlook | www.eia.gov/ieo Monthly Energy Review | www.eia.gov/mer Today in Energy | www.eia.gov/todayinenergy State Energy Portal | http://www.eia.gov/state For more information Adam Sieminski, EIA Drilling Productivity Report October 29, 2013