Download
1 / 58
590 likes | 642 Vues
Learn the essentials of survey design, sampling procedures, and data analysis to gather reliable insights. Understand how to reduce survey errors, raise participation rates, and improve question wording for accurate results. Explore survey content and question order strategies for effective data collection.

E N D
Questionnaire Design, Survey Methods, Sampling and Causal Research Market IntelligenceJulie Edell Britton Session 5 September 4, 2009
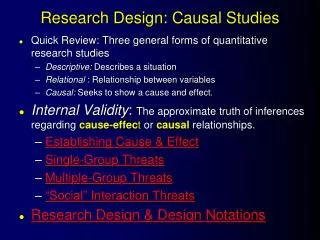
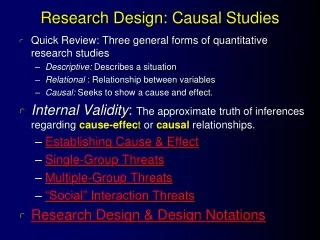
Today’s Agenda • Announcements • Comparative Advertising, Measurement Scales & Data Analysis • Introduction to Survey Research • Sampling Procedures • Causal Research - maybe
Announcements • For Sat prepare Milan Food case – download data (Milan.sav) from the platform, please post your responses by 8 pm tonight – no slides needed. • For Sat prepare WSJ/ Harris Survey – no slides
Comparative Advertising Measurement Scales & Data Analysis • Page 52 packet What do you conclude? Remember – Percentage change or difference can only be calculated with Ratio scales This is an interval scale (at best).
Descriptive Survey Research • Surveys usually used for descriptive research • Provide a snapshot at a point in time • Most analyses univariate or bivariate (but can do elaboration model with control variables) • Would you recommend National to a friend interested in insurance services? Yes 1 No 2 • Bivariate allows for hypothesis testing • Hypothesis: Less educated people more likely to recommend • Descriptive, not causal • Recommendation could be driven by some 3rd factor correlated with education such as income
Sources of Survey Errors • Population definition • Representativeness of the sample frame • Sampling Procedure Used • Respondent Participation: • Willing to participate (Do Not Call) • Comprehend questions • Have knowledge, opinions • Willing & able to respond (language or memory) • Interviewer understands & records accurately
Raising Willingness to Participate • A good response rate requires persuasion • Survey Introduction • Phone or send letter in advance • Introduce self, give affiliation unless this would bias • Describe purpose briefly, w/o making survey sound threatening or demanding • Make respondent feel that s/he is getting chance to provide opinions that will influence market offerings & that her/his cooperation is extremely important
Comprehends Questions? Advice on Question Wording • Be simple and precise • Give clear instructions • Check for question applicability • respondent screening • question branching based on prior answers • Avoid leading & double barrel questions
What’s the Problem? • “Laws should be passed to eliminate the possibilities of special interests giving huge sums of money to candidates” • “Laws should be passed to prohibit interest groups from contributing to campaigns, as groups do not have the right to contribute to candidates they support?”
Comprehends Questions? • Literacy, translation considerations • Conversational Norms • How demanding was Term 3? How demanding was Core Finance? • How demanding was Core Finance? How demanding was Term 3? • How demanding was Managerial Accounting? How demanding was Core Finance? How demanding was Global Economic Environment of the Firm? How demanding was Term 3? “Question order effects in measuring service quality,” by DeMoranville and Bienstock, in International Journal of Research in Marketing, September, 2003
Do Respondents Have Knowledge? • Retrieve answer from memory vs. construct it on spot • Constructed answers are more likely to be influenced by question wording & prior questions. • When answering later questions or engaging in later behavior, likelihood of using earlier answer input A: • positively related to accessibility of A • positively related to diagnosticity (relevance) of A • negatively related to accessibility, diagnosticity of alternative inputs B, C, etc. (Feldman & Lynch) • e.g., when political poll respondents asked: • issue opinion A, presidential voting intention, issue opinion B, • answers to A predict intention, but only for those who did not vote for either candidate in primary
Survey Best Practices: Survey Content, Question Order • Survey Questions • First figure out what questions are needed! • Then order • Lead with interesting, nonthreatening, easy questions • Do you like to play golf? • Have you ever travelled with your clubs? • Can you remember the last time you traveled with your clubs? • Put difficult or sensitive questions well into the interview • How many times did you have to see your doctor for your reconstructive surgery? • What is the size of your company (revenue)? • Usually use funnel order (general to specific) • Use product category? • Brand X? • Do you like Brand X? • Why? 12
Question Order (Cont.) • Survey Questions (cont.) • Inverted funnel (specific to general) for complex topics. • Is your company considering offering training courses on word processing over the Internet? • Database? Spreadsheets? • In general, how big is the untapped market for your software training courses if offered over the Internet? • Group questions in logical order • All questions about one subject together, with transitional phrases in between, “Now I’m going to ask you about agricultural applications of GPS systems...”
Survey Best Practices: Question Order (cont.) • Demographics Questions • Put last—these are less sensitive to prior questions • Seem nosy if put first • Rely on standard approaches for assessing • http://www.norc.org/GSS+Website/ • The Process of Survey Design • Use Backwards Marketing Research to decide what is “need to know” • Draft the survey • Pretest for time, clarity, variability in responses • Revise and retest • Field the survey and keep an eye open for problems
Survey Best Practices:Choosing a Survey Method • Mail, phone, web, in person? • Cost • Complexity of inquiries (branching) • Need for aids • Issue sensitivity • Control over sample
Web and Telephone • Web surveys now dominate. To compare web, in person, phone, mail, see • http://knowledge-base.supersurvey.com/ 17
Free to Fuqua students: Qualtrics • http://www.qualtrics.com/duke#submit • Set up an account • Build surveys • Allows for complex designs • Available to you during this course
Multi-Attribute Attitude Model (MAAM) • Liking for a product as a whole = sum of liking for component parts • Attitude toward brand j = (sum from i = 1 to n for salient attributes) • Importance of Attributei * Evaluationij • Importance • 0 – 100 (allocate 100 points across attributes) • Rating on 1 (unimportant) to 7 (very important) where 0 undefined but implicitly entirely unimportant ) • Evaluation of brand j on attribute I • -4 = poor to +4 = excellent
Measure Types Revisited • Nominal (Unordered Categories) • Just need unique number for each category • Ordinal: ranking scale, intervals not assumed equal • Interval: Intervals assumed equal, zero is arbitrary • Ratio: Intervals assumed equal, zero means zero • To multiply X * Y, (e.g., importance * evaluation), both X and Y must be on ratio scales. • If X1*Y1 > X2*Y2 (XYbrand 1 >XYbrand 2), it does NOT follow that (X1+a)*Y1 > (X1+a)*Y2…. • e.g., 2*2 > 2*(-2), but (2-4)*2 < (2-4)*(-2) • To say % change in Y, Y must be on ratio scales
More on Scaling • To multiply importance x evaluation for each attribute, both must be on ratio scales • 0 on scale must be 0 of underlying quantity • Importance unipolar (all positive). Completely unimportant = 0 weight • Evaluation bipolar (negative to positive). To multiply, must code “neutral” as zero.
I got these by subtracting 4 from the values three slides back Improper Rescaling
Consumer Attitudes • We want to be able to predict consumer behavior • However, instead of examining behavior directly (e.g., choice modeling), we often measure attitudes because… • Measuring attitudes is sometimes easier than observing choice • Attitudes are more diagnostic • Attitudes are sometimes easier to interpret • Attitudes can be reasonable predictors of behavior • Attitudes toward products or brands typically derive from beliefs, actions, and perceptions
Types of Attitude Scales • Semantic differential • Colgate Combo is: • low quality __:__:__:__:__:__:__ high quality • unappealing __:__:__:__:__:__:__ appealing • Constant sum (e.g., Importance) • Purchase intent • Likert scale (Agree-Disagree)
Recap • Survey Design: responses constructed on the spot • Moving parts of a good survey Population definition, choosing a survey method, determining what information needed • Order of questions • Attitude Measurement & multi-attribute attitude model • To multiply or examine percentage differences, data must be on ratio scales
Sampling Terminology • Elements -- Units about which information is sought • Population -- Elements we want to generalize to • Census -- Collect data on all elements in population • Sampling Frame -- At each stage, list of all elements • Sample – Collect data on subset of elements in pop.
Sampling Process • Define population • Elements, extent, time • Identify a good sampling frame • costly to create for yourself • Determine sample size • budget, accuracy needs • Select sampling procedure • way to select elements from the frame • Physically select sample
Probability Samples • Each element in population has known, nonzero chance of being sampled • Simple random sample: all elements have 1/n chance of being sampled (e.g., cold caller) • Systematic sample: start with randomly selected element and take every nth element (e.g., teams in this class) • Cluster sampling: pick groups of elements (city blocks, census tracts, schools) then randomly select n elements from each cluster • Stratified sampling: divide frame into strata according to a characteristic (e.g., gender), then sample randomly from each strata
Complex Sampling Procedures • Simple random sampling almost never used in practice • Stratified Sampling -- Lowers error • Cluster Sampling -- Lowers cost of getting frames and of data collection
Stratified Random Sample • Have frames sorted on some stratification variable believed to influence the variable you are estimating. • Lower variance within each subgroup than across population in general • By ensuring that each subgroup is represented in right mix, extreme overall means less likely -- i.e., smaller std. error.
Steps for Stratified Random Sample • Divide Population into mutually exclusive and exhaustive categories. • Decide what sampling fraction f = n / N to use. • Draw an independent simple random sample of size f * N(stratum) from each stratum. • Compute stratum mean for each • Estimate overall pop mean as weighted average of stratum means • Estimate SE as weighted combo of SEs in each
Cluster Sampling • Typically “clusters” are geographic territories. • Start with list of clusters, randomly select subset, and survey only subset. • Cheaper travel cost, cost per interview • Loss of effective sample size if people in cluster more alike than if in different cluster
Non-Probability Samples • Convenience • Judgment • Pick especially informative elements • Quota • Sample matches population on key control characteristics correlated with behavior under study. • Match only really matters for control variables related to thing you are trying to estimate.
Sampling quiz: • Proportion of WEMBA students interested in changing jobs? Sample of 50 • How would you do: • Convenience Sample • Judgment • Quota sample (by male / female) • Simple random • Systematic • Stratified (by male / female)
Key Sampling Takeaways • Probability v Non-Probability Samples • For Probability Samples, Standard Error is the measure of precision • Precision increases with square root of N • More precision with Stratified if and only if stratifier is correlated with thing estimated • Same principal for Quota samples. Quotas only help if correlated with variable
Experiments • Best way to test causal hypotheses • Independent Variable = hypothesized cause • Manipulated by the researcher/manager • Example: Send a color or black and white brochure • Dependent Variable = effect • Measured (observed) by researcher/manager • Example: New accounts secured • Random assignment of subjects to conditions • Example: receive color or receive b&w brochure
Pre-experimental Designs • One group, after-only design • One group, before & after design • Unmatched control group design • Matched control group design • All have threats to validity not present in a true experiment with random assignment to treatments.
Validity • The strength of our conclusions • i.e., Is what we conclude from our experiment correct? • Threats to Validity • History: an event occurring around same time as treatment that has nothing to do with treatment • Maturation: people change pre to post • Testing: pretest causes change in response • Instrumentation: measures changed meaning • Statistical Regression: Original measure was due to a random peak (SI Cover Curse) or valley
One Group After Only We propose a change in MBA Core, to move Finance and Marketing up to Term 2 from their position in Term 3. One major motive for this is that students interview for internships in Term 3, and if they want jobs in marketing or finance, they have no background at the time of the interview. Thus, we perceive that we are at a competitive disadvantage because those courses are in Term 3. EG X O (Mean = 50%) X = Marketing Term 3, O = Did/Did Not Get Desired Internship Key: Lacks a baseline, so worthless.
One Group Pre-Post Design • Breckenridge Brewery wants to assess the efficacy of TV ad spots for its new amber ale. • Time 1 (O1): Duke undergrads are brought to the lab and asked to rate their frequency of buying a series of brands in various categories over the past week. The list includes Breckenridge Amber Ale. Mean = 0.2 packs per week. • Time 2 (X): Two weeks of ads for Breckenridge Ale. • Time 3 (O2): Same Duke undergrads brought back to lab to rate frequency of buying same set of brands over past week. Mean = 1.3 packs per week. • 1.3 - 0.2 = 1.1. We attribute an increase of 1.1 packs per week to the ad.
Online Investor Performance • X = brick and mortar brokerage customer moves online to trade in 1999 • O = Annualized turnover • 1998 – 40% annualized turnover • 2000 – 100% annualized turnover • Did going online cause people to trade more actively? • Threats with one-group pre-post?
Quasi-Experimental Designs: Interrupted Time Series • Same as one-group pretest posttest, but observations at many points in time before and after key treatment for same people: • EG O1 O2 O3 X O4 O5 O6 • Extra time periods help control for history, maturation, testing. “Quasi-experiment”
2 Groups: Unmatched Control Group(Effect of Prior Knowledge on Search) • Hypothesis: People with little knowledge about cars search less online because they are overwhelmed • 100 Durham residents who are in the market for a car • EG X1 (Auto Shop Course) O1 (6 hrs online) • --------------------------------------------------------- • CG X2 (Electronics Course) O2 (3 hrs online)
2 Groups: Matched Control Group (True Experiment) EG R X1 (Auto Shop Course) O1 (6 hrs) --------------------------------------------------------- CG R X2 (Electronics Course) O2 (3 hrs) Control for Selection Threat. Key Point: For causal research, chance (not respondent) must determine respondent assignment to condition.
Breckenridge Brewery Ads • Breckenridge Brewery wants to assess the efficacy of TV ad spots for its new amber ale. • Time 1 (O1): Duke undergrads are brought to the lab and asked to rate their frequency of buying a series of brands in various categories over the past week. The list includes Breckenridge Amber Ale. Mean = 0.2 packs per week. • Time 2 (X): Two weeks of ads for Breckenridge Ale. • Time 3 (O2): Same Duke undergrads brought back to lab to rate frequency of buying same set of brands over past week. Mean = 1.3 packs per week. • 1.3 - 0.2 = 1.1 increase in number of packs per week.
2-group Before-After Design • Now add a randomly assigned “Control” group with mean scores O1 = 0.3, O2 = 0.5.