
Archiving and Real-Time Visualization of USGS Data for Hydrologic Research
This paper discusses the integration of USGS real-time hydrologic data with advanced visualization tools through the CUAHSI Hydrologic Information System (HIS). By utilizing the Open Source Data Turbine (OSDT), we have developed an online application that continuously harvests USGS instantaneous data, enabling users to analyze and visualize dynamics in discharge and gage height across numerous measurement stations. We also address challenges in memory management and data retrieval, proposing effective solutions to enhance hydrologic research and education.

Archiving and Real-Time Visualization of USGS Data for Hydrologic Research
E N D
Presentation Transcript
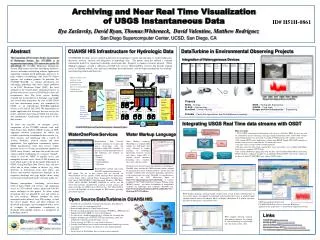
Archiving and Near Real Time Visualization of USGS Instantaneous Data ID# H51H-0861 Ilya Zaslavsky, David Ryan, Thomas Whitenack, David Valentine, Matthew Rodriguez San Diego Supercomputer Center, UCSD, San Diego, CA Abstract CUAHSI HIS Infrastructure for Hydrologic Data DataTurbine in Environmental Observing Projects The Consortium of Universities for the Advancement of Hydrologic Science, Inc. (CUAHSI) is an organization representing 120+ universities in the US and abroad The CUAHSI Hydrologic Information System (HIS) project has been developing databases, services and online and desktop software applications supporting standards-based publication and access to large volumes of hydrologic data from US federal agencies and academic partners. In particular, the CUAHSI WaterML 1.x schema specification for exchanging hydrologic time series, earlier published as an OGC Discussion Paper (2007), has been adopted by the United States Geological Survey to provide web service access to USGS daily values and instantaneous data. The latter service, making available raw measurements of discharge, gage height and several other parameters for over 10,000 USGS real time measurement points, was announced by USGS, as an experimental WaterML-compliant service, at the end of July 2009. We demonstrate an online application that leverages the new service for nearly continuous harvesting of USGS real time data, and simultaneous visualization and analysis of the data streams. To make this possible, we integrate service components of the CUAHSI software stack with Open Source Data Turbine (OSDT) system, an NSF-supported software environment for robust and scalable assimilation of multimedia data streams (e.g. from sensors), and interfacing with a variety of viewers, databases, archival systems and client applications. Our application continuously queries USGS Instantaneous water data service (which provides access to 15-min measurements updated at USGS every 4 hours), and maps the results for each station-variable combination to a separate "channel", which is used by OSDT to quickly access and manipulate the time series. About 15,000 channels are used, which makes it by far the largest deployment of OSDT. Using RealTime Data Viewer, users can now select one or more stations of interest (e.g. from upstream or downstream from each other), and observe and annotate simultaneous dynamics in the respective discharge and gage height values, using fast forward or backward modes, real-time mode, etc. Memory management, scheduling service-based retrieval from USGS web services, and organizing access to 7,330 selected stations, turned out to be the major challenges in this project. To allow station navigation, they are grouped by state and county in the user interface. Memory footprint has been monitored under different Java VM settings, to find the correct regime. These and other solutions are discussed in the paper, and accompanied with a series of examples of simultaneous visualization of discharge from multiple stations as a component of hydrologic analysis. CUAHSI HIS develops service-oriented architecture for hydrologic research and education, to enable publication, discovery, retrieval, analysis and integration of hydrologic data. The project team has defined a common information model for organizing hydrologic observation data, designed a common exchange protocol (Water Markup Language), created a collection of SOAP web services (WaterOneFlow services) that provide uniform access to different federal, state and local hydrologic data repositories, and developed mechanisms for ontology-based data registration and discovery. Integration of Heterogeneous Devices End-to-end three-tier solution: frompublication and registration to discovery and analysis of hydrologic observation data Live data and video from Santa Margarita Ecological Reserve (NEON) HydroDesktop Projects NEON – Ecology: http://neoninc.orgNEES – Earthquake Engineering: http://it.nees.org/ GLEON– Hydroecology: http://gleon.org/CREON – Coral reefs: http://www.coralreefeon.org/ MoveBank– Animal tracking: Bridges and Civil Infrastructure – Engineering: http://www.princeton.edu/~wikelski/research/index.htmhttp://healthmonitoring.ucsd.edu/ PRAGMA– Pacific Rim Applications and Grid Middleware Assembly: http://pragma-grid.net Global search (Hydroseek) Customizable web interface (DASH) Other popular onlineclients Rainfall & Snow Soil water Meteorology Water quantity and quality HTML - XML Desktop clients Data publishing Remote sensing HIS CentralRegistry & Harvester WaterOneFlow Web Services, WaterML Integrating USGS Real Time data streams with OSDT Test bed HIS Servers Ontology ETL services Controlled vocabularies Metadatacatalogs WSDL - SOAP ArcGIS CUAHSI HIS Service Oriented Architecture: General Outline WSDL and ODM registration Matlab • How it works: • USGS NWIS experimental instantaneous web services (GetValues REST service) are used to continuously harvest discharge and gage height information from 7330 USGS stations where both parameters are measured. A catalog of USGS stations and variables is created. • The custom OSDT source application, written using RBNB Simple API (SAPI) connects to the data store to retrieve and cache the 15-minute time series. • The time series are represented as OSDT channels. • The time series for each station, organized by states and counties, are available in RealTime Data Viewer, a common OSDT client. • The custom ODM Sync application loads the data into CUAHSI ODM (Observations Data Model) database, making it available via an additional WaterOneFlow web service, which can be shown in other CUAHSI HIS tools such as DASH (below). IDL, R Ontology tagging (Hydrotagger) WaterOneFlow Services Water Markup Language MapWindow ODM DataLoader Excel External data providers Central HIS servers HIS Lite Servers Streaming Data Loading Programming (Fortran, C, VB) ODMTools Modeling (OpenMI) • WaterOneFlow Web Services provide a uniform way to query and access observations data and metadata within HIS, regardless of intricacies of individual data sources. The following core methods are supported: • GetSites • GetSiteInfo • GetVariableInfo • GetValues • WaterOneFlow method calls return WaterML-compliant documents to Water Markup Language (WaterML) is a standard XML schema for hydrologic time series, designed to support exchange of hydrologic information between servers and clients within HIS. It contains general constructs describing sites, variables, time series, and data values. Server config tools Designed to be the least barrier for adoption by hydrologists, WaterML relies on both the ODM relational schema adopted for managing data from academic projects, and the data and metadata available from government hydrologic repositories at the national and state levels. WaterML 1.0 specification is available as an OGC Discussion Paper at http://www.opengeospatial.org/standards/dp. A recently established OGC/WMO Hydrology Domain Working Group (HDWG) focuses on further development of international standards for hydrologic data exchange, WaterML 2.0:. http://external.opengeospatial.org/twiki_public/bin/view/HydrologyDWG/WebHome HIS clients. The list of data sources that are accessed via WaterOneFlow services include: USGS National Water Information system (Daily Values, Ground Water, Instantaneous Irregular Data, Unit Values), EPA STORET, USDA Snowpack Telemetry (SNOTEL), NCDC ASOS, MODIS, DAYMET, NAM12K, as well as over 40 observation networks contributed by academic research projects and made accessible via ODM Generic Web Services. The WaterOneFlow services and WaterML are being adopted by HIS partners, including government agencies. RDV displays discharge and gage height variables from several stations simultaneously, in one or more panels, and supports fast playback and rewind of time series, at specified speed and time window (above). In addition, RDV can display video/photo, X-Y, tabular, spectrum, text and web data panels, and annotate events. Open Source DataTurbine in CUAHSI HIS OSDT-managed data displayed in CUAHSI DASH (Data Access system for Hydrology) application (the graph shows a simulated air temperature stream) • Solution for accessing both streaming and static data, from different vendor systems, via a common interface • Released under Apache 2.0 Open Source License • Provides real high performance data streaming, 10+MB/sec, 1000 frames/sec • Supported by NASA SBIR, 15 years in development • It is one of just a handful comprehensivesolutions for streaming data • Supports multiple types of streams: real-time monitoring, video and multimedia, telemetry, instant messages, etc. etc. • Can be accessed via URLs (e.g. can stream to browser) • Scalable: DataTurbine servers can be interconnected to handle large streams • Can manipulate the streams: fast forward or slow motion playback (TiVo-like) • Secure access to DataTurbine Server, based on user credentials Links RDV supports deriving channels from primary channels, for example to convert discharge or gage height units the metric system (left) CUAHSI HIS: http://his.cuahsi.org/ HIS Wiki @ SDSC : http://river.sdsc.edu/wiki Open Source DataTurbine: http://www.dataturbine.org Real-time Data Viewer (RDV): http://code.google.com/p/rdv/ The USGS realtime application: http://geo.sdsc.edu/jnlp/usgs.jnlp


