Download

1 / 25
250 likes | 400 Vues
EK 4.A.5 Communities are composed of populations of organisms that interact in complex ways. Data Analysis and Mathematical Models. Communities. The structure of a community is described in terms of species composition and diversity

E N D
EK 4.A.5 Communities are composed of populations of organisms that interact in complex ways Data Analysis and Mathematical Models
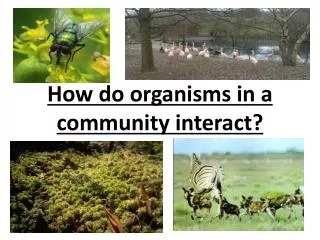
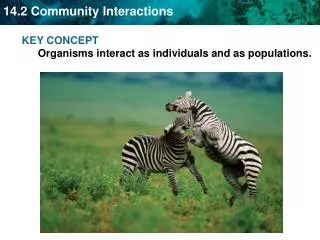
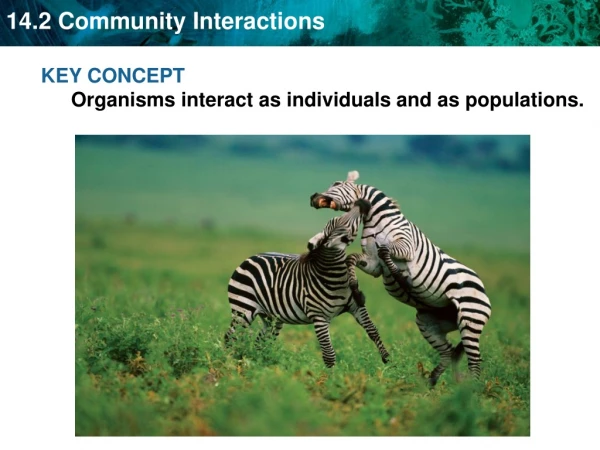
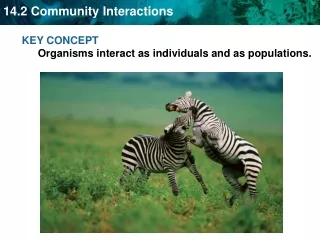
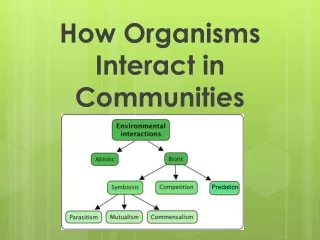
Communities • The structure of a community is described in terms of species composition and diversity • Communities are comprised of different populations of organisms that interact with each other in negative or positive ways • The physical structure of a community is affected by abiotic factors and also the spatial distribution of organisms • The mix of species in terms of both the number of individuals and the diversity of the species defines the structure of the community
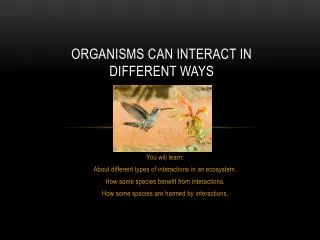
Population Interactions • Predator/prey relationships: Snowshoe Hare and Lynx • Changes in hare pop. is followed by similar changes in lynx pop. – predation limits hare pop. and food supply limits lynx pop. • Fluctuation cycles are commonly observed between predator and prey
Population Interactions • Symbiotic Relationships • Mutualism (+,+) • Acacia trees provide food & housing for ants; in exchange, resident ants kill any insects or fungi found on the tree and crop veg to increase sun exposure for tree • Lichen – algae provide sugar from photosynthesis; fungi provide minerals, water, attachment and protection
Population Interactions • Commensalism (+,0) • Birds build nests in tree (benefit from protection) the tree gets no benefit or harm • Egrets gather around cattle; birds get to eat insects that swarm around cattle; cattle are neither helped or harmed
Population Interactions • Parasitism (+,-) • Tapeworm live in the digestive tract of animals, stealing nutrients from the host • http://youtu.be/rLtUk-W5Gpk
Population Interactions • Introduction of Species • Competitive Exclusion occurs when two species compete for exactly the same resources (they occupy the same niche), one is likely to be more successful. One species outcompetes the other and eventually the second species is eliminated from the area • http://youtu.be/rZ_up40FZVw
Population Interactions • Resource Partitioning occurs when species coexist in spite of apparent competition for the same resources • Species do this by occupying slightly different niches
Population Interactions • Which species of paramecia outcompetes the other? • Paramecium aurelia
Populations • Size is usually designated as N (total number of individuals) • Density – total number of individuals per area or volume • Dispersion – how individuals in a population are distributed
Growth Patterns & Interactions • Age structure – is a description of the abundance of individuals of each age • Rapid growth – many young, few elderly; developing countries • Slow growth – larger at the bottom that slowly narrow; the US • Zero growth – tiers of equal width; Italy
Growth Patterns & Interactions • About 1,000 years ago the human population began population growth thanks to increasing the carrying capacity of our environment • Increase in food supply • Reduction in disease • Reduction in human waste • Expansion of habitat
Growth Patterns and Interactions • Survivorship Curves describe how mortality of individuals in a species varies during their lifetimes • 3 types of curves • Type 1 • Type 2 • Type 3
Growth Patterns & Interactions • Type 1 Survivorship describe species in which most individuals live to middle age; after that mortality is high • Examples: Humans, Elephants
Growth Patterns & Interactions • Type 2 Survivorship describes organisms in which the length of survivorship is random, that is, the likelihood of death is the same at any age – constant death rate • Examples: Rodents and invertebrates
Growth Patterns & Interactions • Type 3 Survivorship describe species in which most individuals die young, with only a relative few surviving to reproductive age and beyond • Examples: oysters, plants, free-swimming larvae, frogs
Growth Patterns & Interactions • Biotic Potential is the maximum growth rate of a population under ideal conditions • Take into consideration the following: • Age at reproductive maturity • Clutch size • Frequency of reproduction • Reproductive lifetime • Survivorship of offspring to reproductive maturity
Growth Patterns & Interactions • Limits to Growth • Density-Dependent factors are those factors whose limiting effect becomes more intense as the population density increases • Examples – parasite & disease transmission; competition for resources; predation
Growth Patterns & Interactions • Limiting Growth Factors • Density-Independent factors occur independently of the density of the population • Examples – natural disasters such as fires, earthquakes, volcanic eruptions; extreme climates such as storms and frosts
Growth Patterns & Interactions • Exponential Growth in a population occurs whenever the reproductive rate is greater than zero. • Producing a J shaped curve • G=rN • G stands for growth, r stands for the per capita rate of increase, and N stands for the population size
Growth Patterns & Interactions • Logistic Growth occurs when limiting factors restrict the size of the population to the carrying capacity of the habitat • Producing a S shaped curve • G=rN*(K-N)/K • K stands for the carrying capacity; as N approaches K the growth rate is slowed, eventually reaching zero growth
Growth Patterns & Interactions • Exponential and logistic growth patterns are associated with two kinds of life-history strategies: • R-selected species • K-selected species
Growth Patterns & Interactions • R-selected species – • Rapid growth (J shaped curve) • Opportunistic species – grasses and insects • Quickly invade a habitat and reproduce immediately (after reproducing they die) • Produce many offspring that are small, mature quickly and require little if any parental care
Growth Patterns & Interactions • K selected species • Population size remains relatively constant at carrying capacity, K – s shaped curve • Produce few offspring that are larger in size and require extensive parental care • Reproduction occurs repeatedly during their lifetime