Download
1 / 72
720 likes | 1.24k Vues
Bellwork. Explain the changes in both numbers and rates of growth in the following population growth curves. Exponential vs. Logistic Growth. Exponential growth occurs when resources are not limiting.

E N D
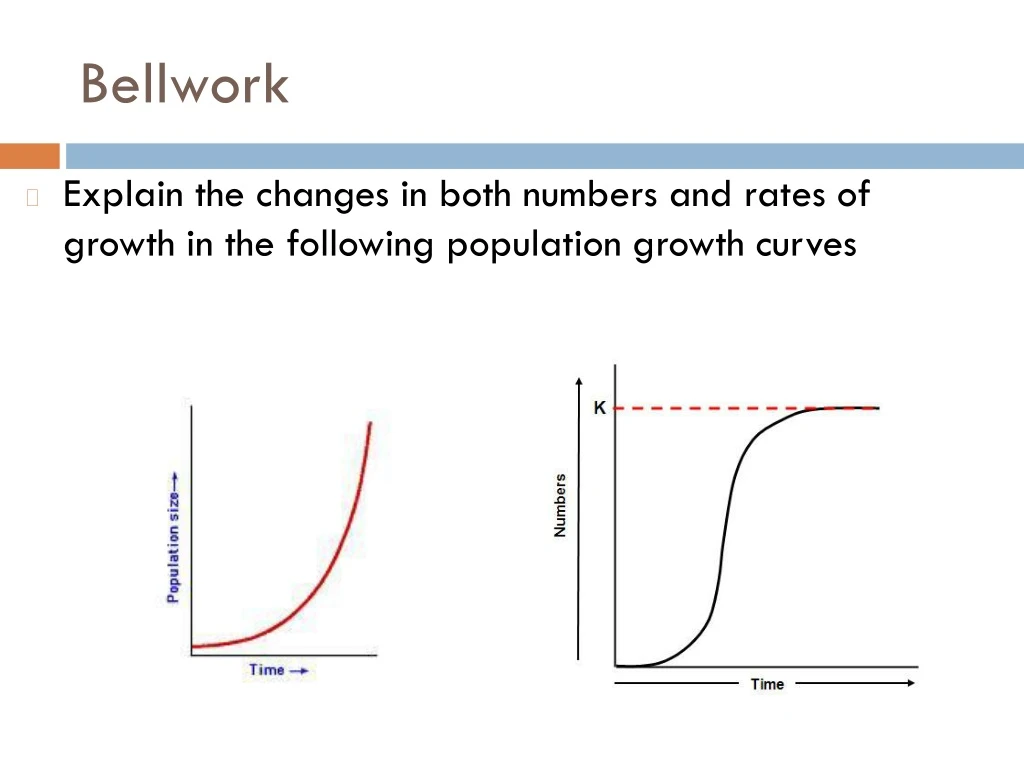
Bellwork • Explain the changes in both numbers and rates of growth in the following population growth curves
Exponential vs. Logistic Growth • Exponential growthoccurs when resources are not limiting. • Logistic growthoccurs when resources become more and more limiting as population size increases.
Population Population Biology Human Population
Characteristics of Populations In terms of dispersion, individuals of a population can be clumped*, uniform, or randomly distributed.
2Population Dynamics & Carrying Capacity Population size is governed by births, deaths and migration • [Population Change] = [Births + Immigration] –[Deaths + Emigration] Population Change = (B + I) – (D + E) • If the number of individuals added by births & immigration are balanced by those lost by deaths & emigration then there is zero population growth;
Population growth • Populations vary in their capacity for growth, also known as biotic potential • The intrinsicrate of increase (r) is the rate at which a population will grow if it had unlimited resources.
Population Growth • As long as there is a plentiful supply of resources populations grow • If we put some bacteria cells in a culture – the bacteria reproduce exponentially • As the population grows, so too does the rate of growth
Population Growth This is an example of positive feedback The curve produced is sometimes called a J-curve The J-curve assumes there is no limit on resources
Population Growth Darwin calculate that if you started with 2 elephants and exponential growth, after 700 years the world population of elephants would be 19,000,000 This obviously has not happened
Population Growth • The size of a population is limited by available resources and competition for them • This results in a maximum size that an environment can sustain • The Carrying Capacity (K)
Population Growth The carrying capacity is around 120 bacterial cells/mL Negative feedback operates keeping the population around the Carrying Capacity
Population Growth • This produces an S curve (logistic growth) • Limiting factors resulting from an increased population provide negative feedback which reduces the growth rate • Food, water, living space, sunlight, etc
Population Growth • Lag phase: population grows slowly (environmental adaptation) • Exponential or Log phase: population grows rapidly exploiting a plentiful resource supply (maximal growth) • Stationary phase: population growth reaches a plateau – the maximum population size under the environmental conditions
Population Regulation • Factors that regulate population size can be categorized as DENSITY-INDEPENDENT or DENSITY-DEPENDENT • Density-Independent– effect does not vary with population density • Weather, climate, fire, volcano • Density-Dependent– effect varies with population density • infectious disease, competition, predation, waste accumulation, stress from crowding • Negative feedback that leads to stability of populations
Population Regulation • Factors that regulate population size can be categorized as INTERNAL or EXTERNAL • Internalfactors – arise from within the population itself • fertility rates, breeding territory size, intraspecefic competition for food, genetic disease, competition for mates • External factors – affect populations from outside the population • predation pressure, parasitism, disease, climate change, interspecific competition
Exceeding the Carrying Capacity Reindeer introduced to a small island off of Alaska in the early 1900s exceeded the carrying capacity, with an "overshoot" followed by a "population crash" in which the population was totally decimated by the mid–1900s.
Exceeding the Carrying Capacity During the mid–1800s sheep populations exceeded the carrying capacity of the island of Tasmania. This "overshoot" was followed by a "population crash". Numbers then stabilized, with oscillation about the carrying capacity.
Population Curves in Nature Population cycles for the snowshoe hare & Canadian lynx are believed to result because the hares periodically deplete their food, leading to first a crash of the hare population & then a crash of the lynx population.
Population Regulation • What regulates population?
Population Regulation • Until the 1940s, the British population of Peregrine falcons had remained fairly constant—about 820 breeding pairs • Limited by available nest sites (same places each year) • Average brood size was about 2.5 fledged young each summer • Come the next breeding season, the population was back to about 820 pairs • Equilibrium
Population regulation Mosquitoes are plentiful in the summer months When autumn sets in, the populations crash Boom and bust
Population Regulation • Some species are very good at taking full advantage of any opportunity • Locust populations can explode • They swarm in the thousands, eat everything in their path, and eventually outstrip their food supply • Boom and bust
Population Regulation • The species described previously demonstrated either an equilibrium or boom and bust population growth • From this, two types of life strategies can be identified: • Equilibrium or K strategy species • Opportunist or r strategy species
Population Regulation r • What are K and r? • The two variables that define a population curve • K = carrying capacity • r = growth rate (intrinsic rate of increase)
K strategists • Low reproductive rate • Large investment in parental care • Late maturity • Slow growth • Large organisms • Late successional species • Niche specialists • Require stable environment • S—shaped curve • NC Zoo • Bomassa born 8/4 and Apollo born 8/31 • Juma born 7/6
R strategists • High reproductive rate • Low investment in parental care • Early maturity • Rapid growth • Small organisms • Pioneer species • Generalists • Rapidly adapt to environmental variation • J—shaped curve
K and r strategists • The reality is more of a continuum • Most organisms are located between the two extremes of this continuum and many show characteristics of both strategies
Survivorship • If survivorship is plotted for different species, three generalized types of life curve form • Type 1 (late loss) – Survivorship is high, most mortality later in life span • Type 2 (constant loss)– Constant mortality throughout life span • Type 3 (early loss)– High mortality early in life, low survivorship into late life span
Family Population • Gather the following information: • Make a list of your living family members starting with your grandparents • Find out the year they were born and indicate if they are male or female • Include all of the brothers and sisters of your parents and everyone in your generation (brothers, sisters, cousins)
Bellwork • Tally your table’s totals for males and females at each age group • We will then combine the whole class data
Age Structure Diagrams • Show the proportion of the population at each age level • Three main age categories: • Prereproductive (ages 0-14) • Reproductive (15-44) • Postreproductive (45+)
How can Age Structure Diagrams be used to make population and economic projections? • Baby-Boom Generations • Creates social and economic changes that ripple through a society for decades • Competition for jobs; political clout; retirement benefits and needs
What are the effects of population decline? • Rapid pop. decline can lead to severe economic and social problems • A sharp rise in proportion of elderly will lead to a large share of medical care, social security and other costly social services • Labor shortages
Human Population Dynamics World Population (7 min)
Human Numbers Through Time • Click for interactive
Factors Affecting Human Population Size • Population change = [births + immigrations] – [deaths + emigration] • Zero Population Growth (ZPG) – when births plus immigration equal deaths plus emigration • Crude Birth or Death Rate - # births or deaths /1,000 people • U.S. CBR – 13.83 • U.S. CDR – 8.38
World Population • Rate of World's Population Change (%) • (Birth Rate – Death Rate)/1000 people x 100 • Average Annual population growth rate • 1.2% (global) • .963 (U.S.) • World Population = 7 billion (video) • China and India - 37% of world's population • U.S. – 4.5% of world's population • Population Clocks
Global Fertility Rates (2 types) 1. Replacement Level Fertility • number of children a couple must bear to replace themselves (2.1 in developed countries and 2.5 in developing countries) • greater than 2 because some female children die before reaching their reproductive years • Population Momentum – The continued growth of a population after reaching replacement level resulting from a large number of people entering their childbearing years
Global Fertility Rates (2 types) 2. Total Fertility Rate (TFR) • most useful for projecting future population change • the average number of children a woman will have during her childbearing years • 2000 • World – 2.9 (1.3 developed, 3.2 developing) • U.S. – 2.1 • 2011 • World – 2.46 • U.S. – 2.06
U.S. Growth • US - highest fertility rate and highest immigration rate of any industrialized country – Why? • 1.66 million more births than deaths; 800,000 legal immigrants; 300,000 illegal immigrants ***Because of the high per capita rate of resource use in the US, each addition to the US pop. has an enormous environmental impact!!