Download
1 / 31
310 likes | 404 Vues
Assessment of agricultural nitrogen balances for municipalities – Example Baden-Wuerttemberg. martin.bach@agrar.uni-giessen.de. EEA Agri-water Expert meeting, Copenhagen, 21-22 Feb 2005. Usage of ‚nitrogen balance surplus‘.

E N D
Assessment of agricultural nitrogen balances for municipalities – Example Baden-Wuerttemberg martin.bach@agrar.uni-giessen.de EEA Agri-water Expert meeting, Copenhagen, 21-22 Feb 2005
Usage of ‚nitrogen balance surplus‘ • EU, OECD: Agri-sustainability indicator - environmental pressures (water, atmosphere) - waste of resources Effectiveness of policies: EU Nitrate Directive, national action programmes Verification of supra-national treaties, e.g. OSPARCOM Sustainability Strategy Program of the German Gouvernment: DUX-Indicator (‚German Environment Index‘) „Trend of the national nitrogen surplus“ Component of „National Gross Environmental Budget“ (UGR, Umwelt- ökonomische Gesamtrechnung), indicating the external costs of nitrogen losses into air, terrestrial ecosystems, surface waters, groundwater, sea WFD implementation: source appointment, prediction of efficiency of reduction measures Farm level: Optimization of N-management (tools e.g.: EMA in the UK; REPRO, QSL in Germany)
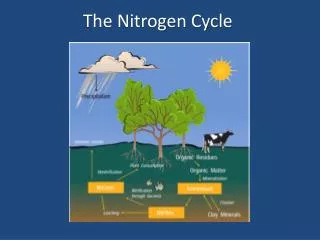
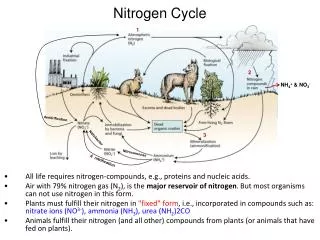
Nitrogen soil surface surplus in the WFD context • „Best available indicator“ for water quality eutrophication by non-point source N lossese.g. Modelling approaches of EUROHARP models,especially MONERIS • WFD: ‚10 km² basin units‘ • spatially differentiated calculation of N surplus • max resolution of ag-census based N balance • Germany: municipalities (EU LAU level 2)
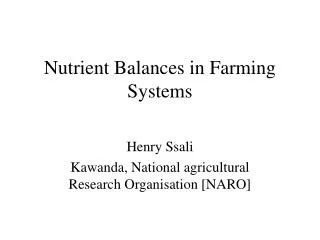
Ag-census based calculationof nitrogen soil surface surplus Problems Lack of data (data secrecy) Estimation of N mineral fertilizing quantities
Missing data of the Agricultural Census Background Data secrecy policy: a statistical data won‘t be published when based on three or less individual values Replacement by estimated figures: missing data recalculted as the difference between „sum over a county“ and „sum over all muncipalities with published data“
Missing data of the Agricultural Census - Crop acreage *) n = 1112 municipalities
Missing data of the Agricultural Census - Livestock *) n = 1112 municipalities
Estimation approch of nitrogen mineral fertilization „farmer‘s N fertilization scheme“: N plant demand= N mineral fertilization +N organic fertilizer*efficiency factor +other N supplyN plant demand:crop specific N demand for optimal harvest yield (table values) N organic fertilizing:N supply to the field with farm produced manure; N supply = N excretion of livestock minus volatilzation losses Efficiency factor: fraction of N in manure which is availabe for the field crop, according to farmers fertilization calculation Other N supply:N-fixation by legumes, secondary organic fertilizers N mineral fertilization = N plant demand–N organic fertilizer*efficiency factor –other N supply
Estimation approach of nitrogen mineral fertilization „Validation“of the assessment: Estimated N mineral fertilizer amounts summed up over all crops and all counties in Germany mineral fertilizer consumption of agriculture in total (census based) Best calibration with an efficiency factor = 36 %(average Germany 1998/2000). Farmers do not accounted for 64 % of N in their manure (= potential losses when planning crop fertilization schemes) Figures (kg N/ha AA, average Germany 1998/2000): plant demand–organic fertilizer*efficiency factor –other supply = mineral fertilizer 144–53 *0,36 –15 = 110 used for calculation of mineral fertilizing of individual municipalities
Nitrogen soil surface surpluskg N/ha AA Nitrogen surplus Results for Municipalities* Baden-Wuerttemberg 1999 *) EU LAU level 2, NUTS 5 no agriculture no data Lake Contance
200 1 : 1-Line 160 120 80 r² = 0,45 40 40 80 120 160 200 Quality check of nitrogen soil surface surplus results Comparison of Ag-Census based vs. empirical N budgets (mainly farm based data) Database: Literature review, 8 studies with together 32 municipalities (in 5 German states)(Bach et al.,1996) Nitrogen surplus based on Agricultural Census (kg N/ha AA) Nitrogen surplus acc. to empirical data (kg N/ha AA)
<= 40 % 41 - 60 % 61 - 80 % 81 - 125 % 126 - 150 % > 150 % Baden-Wuerttemberg: NO3-conc. in aquifers measured vs. modelled Groundwater NO3-concentration Relation measurement / model (%) Source: J. Ruf, Environment Agency Baden-Wuerttemberg, 2004
Resume • Assessment of nitrogen balances for municipalities yields reasonable, quantitative figures with high spatially resolution • Results are an operational tool for the WFD status reports (‚at risk‘ vs. ‘not at risk‘; source apportionment) • But: • Farm-gate balances are methodologically more precise and the results indicate the problem closer to its origin (farms with huge livestock density) • Outlook: Prediction of effectiveness (and efficiency) of nitrogen loss reduction measures in ag production systems needs process- oriented nitrogen models (e.g. SWAT, DNDC and others) - ‚nitrogen surplus‘ is not sufficient for this purpose.
Thank you for your attention! You are a great audience!
MONERIS (Behrendt et al., 1999)Results Baden-Wuerttemberg • Groundwater • Tile drainage • Erosion • Surface runoff • WWTP • Urbans areas • Atmospheric deposition Total Nitrogen emissions from: Source: Landesanstalt fuer Umwelt-schutz Baden-Württemberg, 2000
Landnutzung N-Saldo Hydrogeolog. Einheiten Boden (NAG), Niederschlag Bsp. Hessen: Auswertung WSG WSG-Zonen Zone I Zone II Zone III Zone IIIA Zone IIIB Wasserschutz- gebietszonen
Schätzung NO3-Konz. in GW-Messstellen Regressionsansatz log (CNO3) = a0 + a1*Wald% + a2*Siedl% + a3*Grünl% + a4*(Acker%*N-Saldo) + a5*Tiefe + a6*SWS CNO3 = Mittlere Nitratkonz. des Rohwassers (mg NO3/l) Wald% = Anteil des Waldes an der Gesamtfläche (%) Grünl% = Anteil des Grünlands an der Gesamtfläche (%) Siedl% = Anteil der Siedlung an der Gesamtfläche (%) Acker%*N-Saldo = Produkt aus Ackerlandanteil und mittleremN-Bilanzüberschuss Tiefe = Mittlere Rohwasserentnahmetiefe (m) SWS = Geschätzte mittlere Sickerwasserspende (mm/a)
Modellschritt r2 Korrigiertes r2 1. Wald% ,259 ,258 2. Grünl% ,341 ,339 3. Tiefe ,397 ,395 4. SWS ,418 ,415 Bsp. Hessen: Regressionsgleichung - Brunnen Alle Brunnen-Messstellen (Hessen gesamt), n = 811 log (CNO3) = 1,964 – 7,04E-03*Wald% – 4,15E-03*Grünl% – 2,43E-03*Tiefe – 6,19E-04*SWS 100 75 NO3-Konz. (mg/l) (gemessen) 50 25 0 0 25 50 75 100 NO3-Konz. (mg/l) (berechnet)
SQS r2 Korrigiertes r2 Wald% ,697 ,694 SWS ,716 ,709 Bsp. Hessen: Regressionsgleichung - Quellen (‚SQS‘) Einheit: Nordhessisches Buntsandsteingebiet , n = 82 log (CNO3) = 1,889 – 8,57E-03*Wald% – 5,97E-04*SWS NO3-Konz. (mg/l) (gemessen) NO3-Konz. (mg/l) (berechnet)
Modellberechnung* Messung Grundwasserleiter Kluftgrundwasser Karst Sonstige Bsp. Baden-Württemberg: Berechnete Denitrifikationsraten *) Denitrifikationsrate = f{N-Überschuss LF, N-Deposition Wald, Nutzungsanteile, Sickerwassermenge, c(NO3)-GW gemess. } Quelle: J. Ruf, LfU Baden-Württemberg, 2003
150 150 100 100 50 50 0 0 1950 1960 1970 1980 1990 2000 Nitrogen balance surplus Germany 1950 to 2002* Nitrogen surplus (kg N/ha AA) National balance („farm gate“) Soil surface balance *) 2002: preliminary results
21 - 50 51 - 80 81 - 110 111 - 150 151 - 200 201 - 260 Nitrogen Surplus - Soil surface balance - of the AgriculturalArea (AA) 1999 - Germany, NUTS 3 level (counties) - kg N/ hectare AA
5 - 20 21 - 50 51 - 80 81 - 110 111 - 150 151 - 200 201 - 210 Nitrogen Surplus related to the total land area of the counties (all land uses*) 1999 - Germany, NUTS 3 level (counties) - kg N/ hectare total area *) AA: N soil surface surplus of the agricultural land; other uses (forest; urban and traffic areas): 5 kg N/ha N surplus
N-Bilanzüberschuss Baden-Württemberg MONERIS Ergebnisse (Behrendt et al.) Überschuss Stickstoff-Flächenbilanz • <= 70 kg kg N/ha • 71 – 80 kg N/ha • 81 – 90 kg N/ha • 91 – 100 kg N/ha • 101 – 110 kg N/ha • 111 – 120 kg N/ha • 121 – 130 kg N/ha >130 kg N/ha Quelle: Landesanstalt für Umwelt-schutz Baden-Württemberg, 2000
Nährstoffbilanzierung Baden-Württemberg - MONERIS Baden-Württemberg - Stickstoff-Flächenbilanzüberschuss Landwirtschaft (Bach / 1995) Stickstoff-Hoftorbilanzüberschuss Landwirtschaft (Zeddies / 2001) Quelle: LfU – Landesanstalt für Umweltschutz Baden-Württemberg – Sachgeb. 41.1
Nährstoffbilanzierung Baden-Württemberg - MONERIS Baden-Württemberg - Gesamte spezifische Stickstoff-Emissionen nach MONERIS: • Grundwasser • Drainagen • Erosion • Abschwemmung • Kläranlagen • Urbane Flächen • Atmosphär. Deposition Quelle: LfU – Landesanstalt für Umweltschutz Baden-Württemberg– Sachgeb. 41.1
Überschuss der Stickstoff- Flächenbilanz der Gemeinden in Hessen 1999 kg N / ha LF 20 - 40 41 - 60 61 - 80 81 - 100 101 - 115 115 - 130 Bach und Frede (2002)
Usage of ‚nitrogen balance surplus‘ • EU, OECD: Agri-sustainability indicator - environmental pressures (water, atmosphere) - waste of resources Effectiveness of policies: EU Nitrate Directive, national action programmes Verification of supra-national treaties, e.g. OSPARCOM • Sustainability Strategy Program of the German Gouvernment: DUX-Indicator (‚German Environment Index‘) „Trend of the national nitrogen surplus“ • Component of „National Gross Environmental Budget“ (UGR, Umwelt- ökonomische Gesamtrechnung), indicating the external costs of nitrogen losses into air, terrestrial ecosystems, surface waters, groundwater, sea • WFD implementation: source appointment, prediction of efficiency of reduction measures • Farm level: Optimization of N-management (tools e.g.: EMA in the UK; REPRO, QSL in Germany)