Download
1 / 22
230 likes | 357 Vues
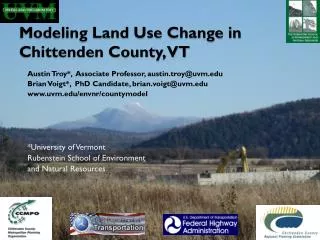
Modeling Land Use Change in Chittenden County, VT Using UrbanSim. Austin R. Troy, PhD austin.troy@uvm.edu Brian Voigt, Research Assistant brian.voigt@uvm.edu. Project: “Dynamic land use and transportation modeling”.

E N D
Modeling Land Use Change in Chittenden County, VT Using UrbanSim Austin R. Troy, PhD austin.troy@uvm.edu Brian Voigt, Research Assistant brian.voigt@uvm.edu
Project: “Dynamic land use and transportation modeling” • Purpose: to simulate future land use, transportation and environmental impact in Chittenden County under baseline and alternative scenarios • US DOT FHWA funded; 2006-2008 • Collaborators: Resource Systems Group (RSG, Inc), CCRPC, CCMPO, UVM • Tools: UrbanSim, TransCAD Image source: Above and Beyond by Alex MacLean, Julie Campoli and Beth Humstone
Research Questions • What will land use patterns in Chittenden County look like in 25 years? • What effect(s) will future development patterns have on the environment? • How might policy and investment strategies influence these outcomes? Image source: Microsoft Virtual Earth
Modeling with UrbanSim • University of Washington • www.urbansim.org • Model parameters based on trend analysis • Integrates market behavior, land policies, infrastructure choices • Simulates evolution of households, jobs and real estate development • agent-based for household and employment location decisions • grid-based for real estate development decisions from Waddell, et al, 2003
The Four D’s of UrbanSim • Dynamic • Disequilibrium • Different time scales • Disaggregated
Grid_ID:23674 HSHLD_ID: 23 AGE_OF_HEAD: 42 INCOME: $65,000 Workers: 1 KIDS: 3 CARS: 4 Grid_ID:23674 Households: 9 Non-residential_sq_ft: 30,000 Land_value: 425,000 Year_built: 1953 Plan_type: 4 %_water: 14 %_wetland: 4 %_road: 3 Grid_ID: 60211 Employment_ID: 427 Sector: 2 Employees: 135 UrbanSim Decision Makers
Services Manufacturing Government Trade Ed and Hlth Serv Financial Transpo & Util Construction 0 20 40 60 80 # of Jobs (1000s) 1970 1990 2004 ? ? ? ? ? Household and Employer Activity • Occupancy / Vacancy • Transition • Mobility • Location • options • decisions • Development is based on supply of and demand for additional units / area
macro-economic model travel demand model output visualization scenario assumptions controltotals submodels model coordinator TDM outputs user specified events export model UrbanSim Model Architecture data store model output modified from Waddell et al., 2001
UrbanSim Model Architecture • Suite of sub-models • land price • accessibility • transition • mobility • location choice • Development • User specifications • model interval: one-year time step • sub-model order and frequency • schedule of TDM runs from Waddell, et al, 2003
Exogenous Inputs: Control Totals • Externally derived inputs • Model does not predict demographic / ecnomic changes • Spatially allocates changes to population / employment • Many estimates; ultimate source to be determined
Top 5 Employment Sectors: 1990 Households by Grid Cell: 2000 Households by Grid Cell: 1990 Model Output • Output database: defines grid cell state • Graphics • maps • charts • tables
Indicators • Predefined indicators • transport: VMT • land use: vacancy, non-residential sq ft • land value • households: income • population: density • Environmental • watershed function • habitat fragmentation Image source: Microsoft Virtual Earth
employment event development event New highway infrastructure New major employer base year Rezone growth center(s) policy event 1 Fuel tax policy event 2 Using a Simulation Model for Comparative Scenario Analysis • What is a scenario? • Alteration of model inputs/ assumptions from baseline • Types of changes that can be assessed • Zoning • Transportation investments • Non-transportation capital investments • State and regional policy • Economic and demographic changes
Potential Zoning Scenarios Modeling the effects of • upzoning, • downzoning, • reconfiguring zone boundaries, • new zoning categories, • density regulations or use changes for specific districts Should have specific zoning changes in mind first
Potential Transportation Investment Senarios Modeling the effects of hypothetical transportation investments like: • new roads / highways • new interchanges, exits • road widening • bus line expansion • carpooling programs
Potnential Non-Transportation Capital Investment Scenarios • All capital investments not included under the transportation scenarios like • Utilities: water, sewer, power, telecomm • Schools • Public facilities (libraries, post offices, courthouses) • Parks/Open Space • Joint public/private developments • Major public institutions Image source: Microsoft Virtual Earth
Potential State and Regional Policy Scenarios Hypothetical state and county level policies, or changes to existing policies, that are expected to affect land use or transportation like: • Tax policies • property tax, current use, gas tax, speculation tax, etc. • State land use policies • growth centers, Act 250, urban service boundary, changes to current use development penalties, etc. • Transportation policies • tolls, congestion pricing, gas tax, etc. • Environmental conservation policies • farmland, wetlands and shoreline protection, etc • Air quality attainment standards
Economic and Demographic Change Scenarios Economic and demographic changes to the county to be prepared for: Economic Examples: • loss or gain of a major employer, increases or decreases in business taxes, telecommuting, energy price spikes or shortages, new federal fuel economy or tailpipe emissions requirements, changes in prices of raw materials, changes to the economy due to global warming Demographic Examples: • regional baby boom, influx of residents from other states due to global warming, changes in household characteristics Image source: Microsoft Virtual Earth
? ? ? ? Methods for implementing scenarios with difficulty level • Changes to control totals • Changes to base year dbase tables • Change to spatial inputs (GIS editing) • Adding/changing variables to UrbanSim • Adding/changing variables to TransCAD • Combination of above • Programming new behaviors ? = increased level of uncertainty due to lack of prior trends or data to analyze or lack of knowledge of behavioral responses
? ? ? Examples • Zoning: density or use changes • Transportation: digitizing new interchanges/exits • Policy: Growth Centers Legislation (if boundaries available) • Employment:loss or gain of a major employer • Non-transportation: joint public/private developments ? = increased level of uncertainty due to lack of prior trends or data to analyze or lack of knowledge of behavioral responses
More Information: www.uvm.edu/envnr/countymodel or Austin Troy: atroy@uvm.edu • Thanks to: US DOT (current funder), RSG, US EPA (previous funder), CCRPC, CCMPO and Research Assistants (Brian Miles, Alexandra Reiss, Galen Wilkerson).