Download
1 / 22
520 likes | 1.37k Vues
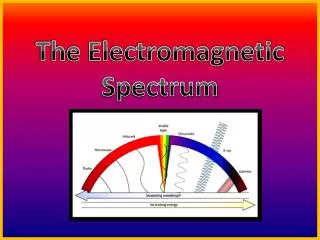
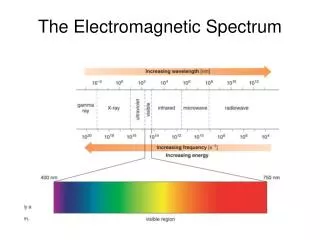
10.5 Spectroscopy and the Electromagnetic Spectrum. The electromagnetic spectrum covers a continuous range of wavelengths and frequencies, from radio waves at the low-frequency end to gamma ( g ) rays at the high-frequency end. 10.6 Infrared Spectroscopy. Infrared (IR) region

E N D
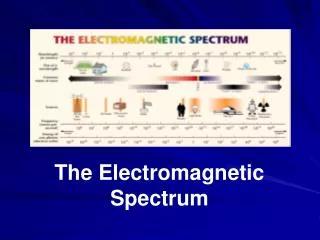
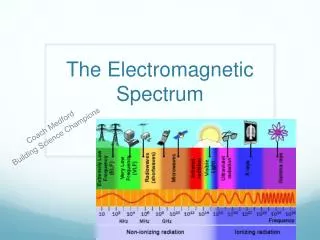
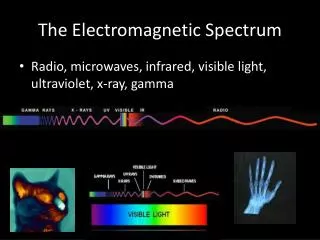
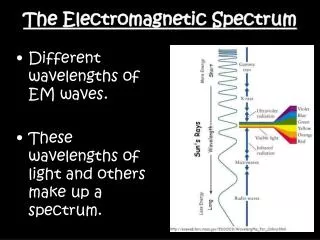
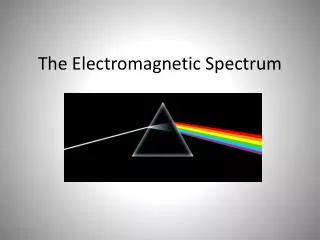
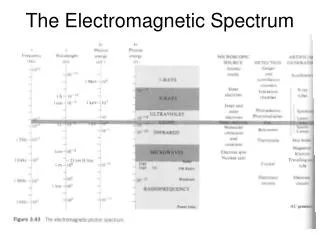
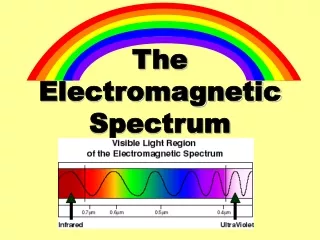
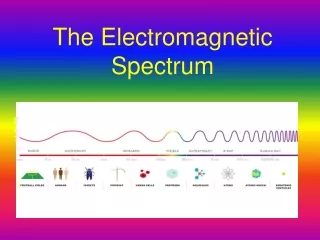
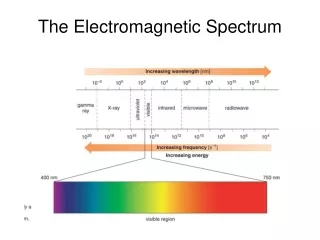
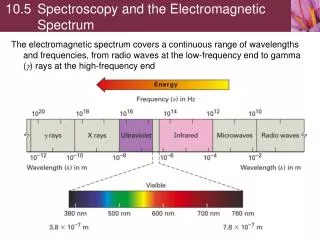
10.5 Spectroscopy and the Electromagnetic Spectrum The electromagnetic spectrum covers a continuous range of wavelengths and frequencies, from radio waves at the low-frequency end to gamma (g) rays at the high-frequency end
10.6 Infrared Spectroscopy Infrared (IR) region • Ranges from 7.8 x 10⁻⁷ m to 10-4 m • 2.5 x 10⁻⁶ m to 2.5 x 10⁻⁵ m used by organic chemists • Wavelengths given in micrometers (1 mm = 10-6 m) • Frequencies given in wavenumbers • Wavenumber • Reciprocal of wavelength in centimeters • Expressed in units of cm-1
Infrared Spectroscopy Molecules stretch or bend at specific frequencies • Energy is absorbed if the frequency of the radiation matches the frequency of the vibration IR spectrum →What molecular motions? →What functional groups?
10.7 Interpreting Infrared Spectra Most functional groups have characteristic IR absorption bands that don’t change from one compound to another
Infrared Spectra of Some Common Functional Groups Characteristic aldehyde and ketone IR absorptions
Infrared Spectra of Some Common Functional Groups Characteristic ester IR absorptions