
Uploaded by
mark-nicholson
24 SLIDES
310 VUES
240LIKES
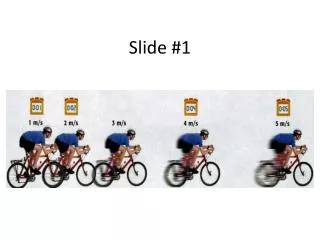
Motion Graphs Interpretation: Understanding X-T and V-T Graphs for Object Motion Analysis
DESCRIPTION
Dive into interpreting X-T and V-T graphs to analyze object motion effectively. Learn how to interpret motion maps and understand the relationship between time, velocity, and distance in physics concepts.
Download
1 / 24
Télécharger la présentation 
Motion Graphs Interpretation: Understanding X-T and V-T Graphs for Object Motion Analysis
An Image/Link below is provided (as is) to download presentation
Download Policy: Content on the Website is provided to you AS IS for your information and personal use and may not be sold / licensed / shared on other websites without getting consent from its author.
Content is provided to you AS IS for your information and personal use only.
Download presentation by click this link.
While downloading, if for some reason you are not able to download a presentation, the publisher may have deleted the file from their server.
During download, if you can't get a presentation, the file might be deleted by the publisher.
E N D
Presentation Transcript
Slide #3 Object A Object B
Slide #4 Object 1 Object 2
Slide # 20 – interpret as an x-t or v-t graph*Look closely at where the x-axis is


More Related
Audio
Live Player