A Personalized Interferon Therapy for Chronic Hepatitis B
670 likes | 848 Vues
A Personalized Interferon Therapy for Chronic Hepatitis B. Jia-Horng Kao MD, Ph D Graduate Institute of Clinical Medicine, Hepatitis Research Center, Department of Internal Medicine, National Taiwan University College of Medicine and Hospital. October 30, 2012. Outline.

A Personalized Interferon Therapy for Chronic Hepatitis B
E N D
Presentation Transcript
A Personalized Interferon Therapy for Chronic Hepatitis B Jia-Horng Kao MD, Ph D Graduate Institute of Clinical Medicine, Hepatitis Research Center, Department of Internal Medicine, National Taiwan University College of Medicine and Hospital October 30, 2012
Outline • Update on the disease • Current status of antiviral treatment • Pegylated interferon • Predictors • Personalized medicine • Risk calculator • Individualized therapy
Hepatitis B virus (HBV) • A DNA virus (3.2 kb): S, C, P and X genes • Replicate via an RNA intermediate (Pregenomic RNA) • Reversely transcribed into HBV DNA by virus-encoded polymerase (error prone RT activity) • Variation rate:1.4-3.5x10⁻⁵/site/year • The reverse transcription step accountsfor the majority ofpoint mutationsand deletionsorinsertions observed in HBV genome • Genotype / subgenotype • Recombinant • Variant / mutant • Quasispecies
Hepatitis B: a global health problem • > 350 million people are chronic HBV carriers worldwide • The world’s 10th leading cause of death • Chronic HBV infection is endemic in the African and Asian-Pacific regions (HBsAg prevalence > 8%) • Usually acquired perinatally or in early childhood • Adverse sequelae may develop (hepatic decompensation, cirrhosis or HCC) • 25-40%of HBV carriers die prematurely of end-stage liver disease
Immune Immune Low Replication Reactivation Clearance Tolerance Phase Phase (Inactive-carrier state) (HBeAg+ CHB) (HBeAg- CHB) HBeAg+ HBeAg-/anti-HBe+ (precore/core promoter mutants) > 2000 IU/mL HBV DNA < 2000 IU/mL > 2 x 10⁷IU/mL > 2 x 10⁴ IU/mL ALT Normal/minimal change/mild CH Moderate/severe CH Normal/mild CH/moderate fibrosis Moderate/severe CH 8-10%/yr 2-6%/yr Cirrhosis Inactive cirrhosis Cirrhosis Natural history of perinatally acquired chronic HBV infection 20-30% Modified from Lok et al. Hepatology 2007;45:507-539 and Pungpapong et al. Mayo Clin Proc 2007;82:967-975.
Annual rates of progression during chronic HBV infection Chronic HBV infection 30-40% 60-70% <1.0% Inactive carrier state Chronic hepatitis B 2-6% for HBeAg(+) hepatitis B 8-10% for HBeAg(-) hepatitis B <0.2% 2-3% Compensated cirrhosis 3-5% Hepatocellular Carcinoma Decompensated cirrhosis 7-8% 20-50% 20-50% Death Fattovich et al. 2004.
Factors associated with disease progression in HBV carriers Viral Persistent presence of HBeAg Persistently high HBV-DNA level HBV genotype C > genotype B Core promoter mutations and Pre-S deletion* Host Male gender Increasing age Recurrent ALT flare Persistently increased ALT levels Cirrhosis* Diabetes* Environment Heavy drinking Cigarette smoking* Aflatoxin* HCV, HDV, or HIV coinfection *Factors shown to be associated with an increases risk of HCC only. Abbreviations: ALT, alanine aminotransferase; HBeAg, hepatitis B e antigen; HCC, hepatocellular carcinoma Modified from Kwon and Lok. Nat. Rev Gastroenterol Hepatol 2011; 8: 275–284.
HBV DNA, HBsAg and ALT levels during different phases of CHB Janssen et al. Gut 2012.
Identification of inactive infection using HBsAg and HBV DNA levels Analysis of 209 HBV genotype D patients • Confirmed in other studies in genotype D (Manesis AASLD 2010) • Confirmed in other genotypes (Martinot-Peignoux APASL 2011) Brunetto et al. Gastroenterology 2010; Manesis et al. AASLD 2010; Martinot-Peignoux APASL 2011
Proposed algorithm to categorize risk of disease progression and management in Asian HBeAg-negative patients N=1068 Taiwanese HBeAg-negative patients with HBV DNA <2000 IU/mL followed up for mean duration of 13 years Demonstrated the clinical utility of HBsAg levels for defining carriers at minimal risk and actionable information for the physician Follow up (months) according to risk ≥2000 IU/mL ≤3 mo or treat Abnormal 3–6 mo ≥1000 IU/mL Asian HBeAg(-) HBV carriers HBV DNA 6–12 mo ALT <2000 IU/mL Normal HBsAg 12 mo <1000 IU/mL Tseng et al. Hepatology 2012
qHBsAg can predict spontaneous HBsAg loss in HBV carriers Serum HBsAg level <100 IU/ml at 1 year post-HBeAg seroconversion can predict HBsAg loss within 6 years1 HBsAg <10 IU/ml is the strongest predictor of HBsAg loss in HBeAg-negative patients who have HBV DNA <2000 IU/ml2 Decreasing HBsAg level (<200 IU/ml or a decrease of 1 log 10 IU/ml) can predict HBsAg seroclearance in inactive CHB patients3 • Tseng, Kao et al. Gastroenterology 2011 • Tseng, Kao et al. Hepatology 2012 • Chen YC, et al. Clin Gastroenterol Hepatol 2011
qHBsAg can predict HCC risk in HBV carriers HBsAg > 1000 IU/ml could predict HCC risk in HBeAg-negative patients, especially in those who have HBV DNA <2000 IU/ml4,5 1. Tseng and Kao et al. Gastroenterology 2012 2. Chen et al. AASLD 2011 Abstract 1095
HBsAg level is an important risk factor in patients with low HBV DNA level (<2000 IU/mL) ERADICATE-B (2688 HBV carriers) 5-fold risk increase by univariate analysis Tseng, Kao. Gastroenterology 2012; Chan HL. Gastroenterology 2012
Outline • Update on the disease • Current status of antiviral treatment • Pegylated interferon • Predictors • Personalized medicine • Risk calculator • Individualized therapy
Goal of treatment for CHB Short-term vs. Long-term Durable response Initial response Anti-HBegain HBeAg(+)patients HBeAgloss Prevent complications Prolong survival HBV DNAundetectable ALTnormalization TIME Primary aim of treatment: Permanently suppress HBV replication Initiation of treatment Liaw et al. Asia Pacific Consensus Statement 2008. Hepatol Int 2008.
Treatment strategies of CHB NAs INTERFERON
Outline Update on the disease Current status of antiviral treatment Pegylated interferon Predictors Personalized medicine
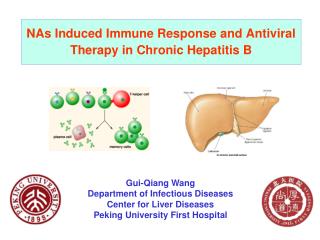
Immunopathogenesis of HBV infection NK NKT Macrophage Cytokines IFNγ TNFα Cytokines Direct cytotoxicity CD8 CD4 B cell Non-Cytolytic Hepatocyte Cytolytic Ig Clearance Apoptosis Innate Immune System Adaptive Immune System Ganem D. NEJM 2004;350:11118-29. Edward D. Gastroenterology 2001;120:1000-8.
Immunopathology of chronic HBV infection Viral replication Immune response CD8+ HBV Immune tolerance CD8+ HBV Clearance phase Chronic hepatitis HBV Seroconversion Remission CD8+ Guidotti Science 1999; Guo J Virol 2000; Kakimi J Exp Med 2000; Zhu J Virol 2001
IFN/Peg-IFN, dual mode of action-The only approved immunomodulatory agent IFN Direct antiviral effect Modulation of immune responses • MHC class I protein display enhanced • activation of CTL and NK cells • 2‘,5‘-oligoadenylate synthetase induction leading to viral cleavage • IFN-inducible human MxA protein-> breakdown viral RNA
PEG-IFN treated HBeAg+ CHB patients: T cell response and T-regs HBcAg-induced proliferation Percentage regulatory T cells Responders Responders Non-responders Non-responders 20 * 4 16 3 12 * Stimulation index 2 % T reg of CD4+ cells * 8 1 4 0 0 0 8 52 78 0 8 52 78 Time (weeks) Time (weeks) Tang, et al. J Hepatol 2005; Sprengers, et al. Antiviral Therapy 2007.
Outline Update on the disease Current status of antiviral treatment Pegylated interferon Predictors Personalized medicine Risk calculator Individualized therapy
Responder to standard IFN therapy Younger age (short duration of infection) Female gender Child bearing age Compensated liver disease HBeAg-positive Low baseline HBeAg level and early HBeAg suppression High ALT (> 5x ULN) Low baseline HBV DNA (<109 copies/ml) and more profound suppression of HBV DNA during therapy Genotype A or B Significant necro-inflammatory activity Kao JH. Hepatol Res 2007;37:S47-S54.
Pegylated interferon alpha: • Baseline predictors • In HBeAg-positive CHB, predictors of anti-HBe seroconversion are low viral load (< 2x10⁸ IU/mL),high serum ALT levels (> 2-5 times ULN),HBV genotype(A and B) and high activity scores on liver biopsy (at least A2) • In HBeAg-negative CHB, no strong pre-treatment predictors of VR EASL Clinical Practice Guidelines: Management of Chronic Hepatitis B 2012.
Best response to Peg IFN- in Asian patients with high baseline ALT and low HBV DNA ≤10 log10 HBV DNA >10 log10 HBV DNA HBeAg seroconversion 24 weeks after the end of treatment 52% 36% 32% 28% Patients (%) 22% 12% 8/29 2/17 10/45 18/56 22/61 13/25 > 2 - < 5 × ULN > 5 × ULN < 2 × ULN ALT Cooksley et al. Shanghai Hong Kong International Liver Congress 2006.
HBV genotype and IFN response Kao JH et al, J Hepatol 2000; Liu & Kao, Liver Int 2005
Effect of HBV genotype on rate of HBeAg seroconversionin HBeAg+ve CHB pts with pegIFN therapy After (a) Janssen et al and (b) Lau et al-
Meta-analysis of 721 HBeAg+ patients receiving 1yr-Peg-IFN: Prediction by BL factors Genotype ALT DNA Nomogram Buster et al, Gastroenterology 2009;137:2002
NEPTUNE: Similar high rate of HBeAg seroconversion for genotypes B and C HBeAg seroconversion for patient treated with 180 µg PEGASYSfor 48 weeks Genotype B (N=45) or C patients (N=67) 60 50 42% 39% 40 19/45 26/67 Response 6 monthspost-treatment (%) 30 20 10 0 C B Genotype Genotype B and C patients respond equally well to PEGASYS Xie et al. APASL 2011 Poster 97 Liaw et al. Hepatology 2011
Response rates are highest with180 µg/week for 48 weeks in genotype B HBeAg seroconversion HBV DNA <2,000 IU/mL 47% 42% 34% Response 6 monthspost-treatment (%) Response 6 monthspost-treatment (%) 29% 24% 24% 19% 12% 180 mg/48n=45 90 mg/48n=45 90 mg/24n=49 180 mg/24n=47 90 mg/48n=45 90 mg/24n=49 180 mg/24n=47 180 mg/48n=45 ALT normalization 64% 53% 45% 37% Response 6 monthspost-treatment (%) 180 mg/48n=45 90 mg/24n=49 180 mg/24n=47 90 mg/48n=45 Liaw et al. Hepatology 2011
Response rates are highest with180 µg/week for 48 weeks in genotype C HBeAg seroconversion HBV DNA <2000 IU/mL 39% Response 6 monthspost-treatment (%) Response 6 monthspost-treatment (%) 25% 21% 24% 16% 11% 7% 10% 90 mg/24n=70 180 mg/24n=76 90 mg/48n=68 180 mg/48n=67 90 mg/24n=70 180 mg/24n=76 90 mg/48n=68 180 mg/48n=67 ALT normalization 49% 35% 29% Response 6 monthspost-treatment (%) 24% 180 mg/48n=67 90 mg/24n=70 180 mg/24n=76 90 mg/48n=68 Liaw et al. Hepatology 2011
HBV genotype Ba genomic background and response to IFN therapy Is there any IFN sensitivity-determining region in HBV genome? Full-length viral genomic comparison between HBVs obtained from IFN-R and IFN-NR 18 HBV genotype Ba pts, 24-wk IFN therapy 10 IFN-Rs vs. 8 IFN-NRs; comparison of paired genomes in IFN-NRs Findings: Pretreatment full-length viral nucleotide consensus sequence identical between Rs and NRs. Genetic complexity of HBV quasispecies also comparable between Rs and NRs. Conclusion: An IFN sensitivity-determining region might not exist within genome of HBV genotype Ba. Liu CJ et al, Antivir Ther 2004;9:895
Baseline viral factors affecting Tx outcomes in HBeAg+ pts with 6M Peg-IFN alfa-2a (N=115) P=0.004 P=0.125 P=0.086 P=0.013 P=0.014 P=0.469 P=0.731 P=0.403 P=0.412 P=0.567 HBeAg SC+ VL< 20,000IU/mL Tseng TC, Kao JH, et al. Antiviral Therapy 2011.
HBeAg seroconversion and combined response rates were 26.1% and 18.3%, respectively. Multivariate analysis BCP mutation (OR: 8.13, 95% CI: 2.02-32.65) was associated with a higher sustained HBeAg seroconversion rate; BCP mutation (OR: 9.28, 95% CI: 1.92-44.99) and viral load < 2x10⁶ IU/mL (OR: 4.78, 95% CI: 1.37-16.69) were associated with a higher combined response rate. Results Tseng TC, Kao JH, et al. Antiviral Therapy 2011.
Baseline viral factors affecting Tx outcomes in HBeAg+ pts with 6M Peg-IFN alfa-2a (N=115) * Viral load, high is ≥2x10⁶ IU/ml; low is <2x10⁶ IU/ml. Tseng TC, Kao JH, et al. Antiviral Therapy 2011.
Pegylated interferon alpha:On-treatment predictors ALT level HBV DNA level HBeAg level HBsAg titer
On-treatment ALT flares are indicative of enhanced immune response ALT flares during Peg IFN are associated with host immune response ALT flares after Peg IFNtherapy are virus induced Peg IFN treatment Peg IFN treatment 14 12 25 12 12 10 10 20 10 8 8 15 8 ALT (x ULN) Log H BV DNA ALT (x ULN) Log H BV DNA 6 6 6 10 4 4 4 5 2 2 2 0 0 0 0 0 8 16 24 32 40 48 56 64 72 78 0 8 16 24 32 40 48 56 64 72 78 ALT HBV DNA Flink et al. Gut 2005.
On-treatment ALT flares predict response to Peg IFN therapy Peg IFN--2b Peg IFN--2a 100 90 80 70 58% 60 44% Patients achieving response* (%) 50 40 30 20% 20 10 0% 0 Hostinduced N=24 Virus inducedN=25 HostinducedN=18 Virus inducedN=10 Flink et al. Gut 2005; Piratvisuth et al. ILC 2006.
Quantitative HBeAg at weeks 12 and 24relationship to HBeAg seroconversion HBeAgseroconversion at wk 72 * HBeAg (PEIU/ml) *P=0.059 Fried, et al. Hepatology. 2008;47:428-434.
Prediction of response to PEGASYS: HBeAg vs. HBV DNA MeanHBeAg(PEIU/mL) Mean HBV DNA(log cp/mL) Week 24: HBeAg >100 U/mL: NPV 96% HBV DNA > 9 log: NPV 86% HBeAg is a better negative predictor of response than HBV DNA Fried et al, Hepatology 2008.
HBsAg level at week 12is associated with 6 months post-treatment response 60 60 51 50 50 40 40 29.7 29 30 30 (% patients) (% patients) HBeAg seroconversion HBeAg seroconversion 16 20 20 10 10 0 0 <1500 Overall 1500–20,000 >20,000 HBsAg (IU/ml) 51% of patients withHBsAg <1500 IU/mL at week 12achieved HBeAg seroconversion 6 months post-treatment HBsAg level (IU/mL) 1500–20,000 <1500 >20,000 HBsAg clearance = 10% pts overall 18% pts with HBeAg seroconversion HBeAg-positive patients 55% 21% 24% Proportion of patients Lau et al. AASLD 2008; Lau et al. APASL 2009 Poster 083
NEPTUNE: On-Treatment HBsAg Level as Marker of Response to PegIFN HBeAg-positive patients: pegIFN alfa-2a 180 µg/wk for 48 wks HBsAg analyzed at baseline and every 12 wks HBsAg levels (IU/mL) at Wk 24 HBsAg levels (IU/mL) at Wk 12 < 1500(n = 46) < 1501-20,000 (n = 52) > 20,000 (n = 16) < 1500(n = 31) < 1501-20,000(n = 62) > 20,000(n = 21) 14% 100 19% 100 27% 40% 80 80 P = .0003 P < .0001 46% 54% P = .0015 P = .0004 57 58 60 60 54 Response 6 Mos Posttreatment (%) 52 42 35 40 40 31 P = .3819 19 P = .2866 20 20 10 7 0 0 0 0 0 0 0 0 0 0 HBeAg Seroconversion HBV DNA < 2000 IU/mL HBsAg Clearance HBeAg Seroconversion HBV DNA < 2000 IU/mL HBsAg Clearance Gane E, et al. EASL 2011. Abstract 69.
NEPTUNE: On-Treatment HBsAg as Marker of Response to PegIFN HBsAg < 20,000 IU/mL identified as key marker of response HBsAg > 20,000 IU/mL at Week 12 or 24 predicts lack of HBeAg seroconversion Negative predictive value: 100% Combination of ALT level and HBsAg decline improves positive predictive value HBsAg Levels at Week 12 < 1500 IU/mL 1500-20,000 IU/mL Week 12 Week 24 100 100 > 20,000 IU/mL 80 80 68 60 60 HBeAg Seroconversion 6 Mos Posttreatment (%) HBeAg Seroconversion 6 Mos Posttreatment (%) 47 46 45 45 40 40 31 20 20 0 0 0 0 0 0 1-2 x ULN > 2 x ULN (n = 93) < 20,000 (n = 21) > 20,000 (n = 98) < 20,000 (n = 16) > 20,000 ALT HBsAg (IU/mL) Gane E, et al. EASL 2011. Abstract 69.
Practical application of response-guided therapy (RGT) of Peg-IFN by HBsAg levels Identify non-responders (NPV) Identify responders (PPV) • Week 12/24: • HBeAg-positive • HBsAg <20,000 IU/mL • HBeAg-negative • >10% decline in HBsAg (Week 24 for GT D) • Week 12/24: • HBeAg-positive • HBsAg >20,000 IU/mL • HBeAg-negative (GT D) • No decline in HBsAg and <2 log decline in HBV DNA e+ e+ e- e-
Summary: Prediction of response to Peginterferon Individualize therapy in patients based on on-treatment HBsAg levels Alternatively, serum HBV DNA or HBeAg can be used ALT flare during therapy predicts a better response