Download
1 / 31
310 likes | 457 Vues
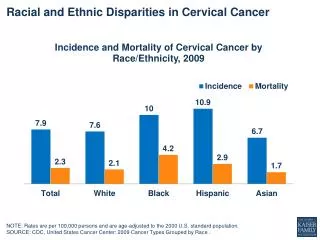
Mapping and Cancer Disparities. Robin Taylor Wilson, PhD Assistant Professor Epidemiology Division Department of Public Health Sciences Penn State College of Medicine. Overview. Colon Cancer in Pennsylvania Exploratory Spatial Data Analysis (ESDA) Software Development.

E N D
Mapping and Cancer Disparities Robin Taylor Wilson, PhD Assistant Professor Epidemiology Division Department of Public Health Sciences Penn State College of Medicine
Overview • Colon Cancer in Pennsylvania • Exploratory Spatial Data Analysis (ESDA) Software Development
Why use spatial data analysis? • Help prioritize cancer control and identify areas of success • e.g. left- and right-sided colon cancer screening • Help to understand access to screening and treatment in relation to stage at diagnosis • Classify environmental exposures not readily assessed by questionnaire or biomarkers • e.g. organophosphate pesticides • e.g. UVB index • Provide etiologic clues to disease • e.g. neighborhood context and physical activity • May prevent a major cancer cluster investigation
Spatial Analysis of Left- and Right-Sided Colon Cancer in Pennsylvania • Rationale: • The incidence of colon cancer in Pennsylvania is higher than the US all-races rate • Understanding left-sided spatial clustering may help focus cancer screening efforts in the state • Purpose: • Determine whether geographic clustering of colon cancer incidence occurs and whether cluster patterns differ by stage and site (left- versus right-sided) • Identify county-level characteristics associated with incidence
Methods: Colon Cancer in PA • Cases diagnosed between 1994-2002 were identified through the Pennsylvania Cancer Registry • Principal components analysis was used to create a county-level SES index based on 7 variables from the 2000 Census • County-level colon cancer screening and obesity prevalence were derived from the Behavioral Risk Factor Surveillance System • SaTScan was used to determine geographic clustering by county, adjusted for confounding variables • Poisson regression estimated incidence rate ratios (IRR) and 95% confidence intervals (CI) according to the county-distribution of age, sex, race, SES index, obesity, screening, and rural residence as defined by the Beale rural-urban continuum
Components of SES Index: Principal Component 1: 72% of variance
Right-sided Left-sided Gender Race Age Gender Race Age SES Gender Race Age Screening Gender Race Age Obesity SatScan: Spatial Cluster Results
Gender, Race, Age, SES Gender, Race, Age, Screening
Summary: Colon Cancer in PA • Lower SES was associated with higher left-sided colon cancer incidence (IRR=1.11, 95% CI: 1.03-1.19, p-trend=0.003), adjusting for age, sex, race, screening and obesity. • Clustering of late stage cancer persisted in two metro regions, including a three-county area in the north east (Beale=2) and two southeastern counties (Beale=1). • Adjustment for SES revealed a cluster of late stage cancer incidence in rural non-metro counties in the western portion of the state.
Conclusion: Colon Cancer in PA • Geographic clustering of left-sided and late stage colon cancer occurs. • The association between left-sided colon cancer and low SES requires replication.
Exploratory Spatial Data Analysis • Incidence Mapping • SatScan • O/E • Local Moran’s I • Star Plot overlay • Parallel Coordinate Plots
ESDA Example: Prostate Cancer Health Disparities • Multiple State Partners • New York • New Jersey • Iowa • South Carolina • Kentucky • Georgia • Pennsylvania • County-level and Census-Tract analyses
Acknowledgements • Penn State Department of Public Health Sciences • Eugene Lengerich • Erik Lehman • Yihai Liu • Penn State Department of Geography • Frank Hardisty • Mark Gahegan • Dan Addyson • State Partners • Gene Weinberg, Pennsylvania Department of Health • Tim Aldrich and Shannon Shropshire, East Tennessee State University • Jay Christian, University of Kentucky • Michele West and Gerard Rushton, University of Iowa • Frank Boscoe, School of Public Health, SUNY • Colleen McLaughlin, NY State Department of Health • Stanley Weiss, University of Medicine and Dentistry of New Jersey
Panel 1 2 3 4 Adjustedfor Gender Race Age Gender Race Age SES Gender Race Age Screening Gender Race Age Obesity SatScan: High and Low Clustering Right Sided Left Sided
Correlation between Model Covariates: SES Index, Screening prevalence and Obesity
Right Colon Left Colon Anatomy of colon and rectum
Obesity Gender, Race, Age