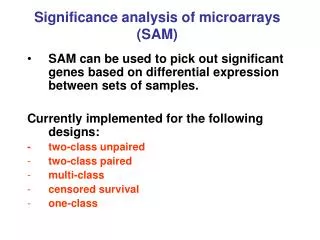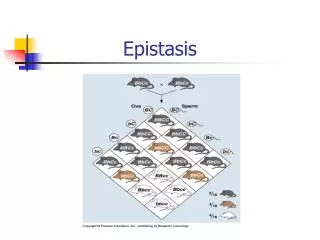
Epistasis Analysis Using Microarrays
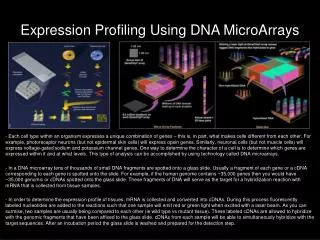
Epistasis Analysis Using Microarrays. Chris Workman. Experiments with Microarrays. Cool technology, but how do we use it? How is it useful? Identify “marker genes” in disease tissues Classification, diagnostics Toxicology, stress response Drug candidate screens, basic science

Epistasis Analysis Using Microarrays
E N D
Presentation Transcript
Epistasis Analysis Using Microarrays Chris Workman
Experiments with Microarrays • Cool technology, but how do we use it? How is it useful? • Identify “marker genes” in disease tissues • Classification, diagnostics • Toxicology, stress response • Drug candidate screens, basic science • Genetic factors • Measuring interactions (chIP-on-chip)
Overview • Expression profiling in single-deletions • Epistasis analysis using single- and double-deletions • Epistasis analysis, genetic and environmental factors • Reconstructing pathways that explain the genetic relationships between genes
Expression Profiling in 276 Yeast Single-Gene Deletion Strains(“The Rosetta Compendium”) • Only 19 % of yeast genes are essential in rich media • Giaever, et. al. Nature (2002)
Experimental Design • Compare single-gene deletions to wild type • Compare to the double knockout to wild type
Classical Epistasis Analysis Using Microarrays to Determine the Molecular Phenotypes Time series expression (0-24hrs) every 2hrs
Expression in Single-Gene Deletions(yeast mec1 and dun1 deletion strains)
Chen-Hsiang Yeang, PhD Craig Mak MIT UCSD UC Santa Cruz Yeang, Jaakkola, Ideker. J Comp Bio (2004) Yeang, Mak, et. al. Genome Res (2005)
“Systems level” understanding Treat disease Synthetic biology In silico cells Measurements Networks
“Systems level” understanding Treat disease Synthetic biology Test & Refine In silico cells Measurements Networks
Displaying deletion effects Published work: “Epistasis analysis using expression profiling” (2005)
Relevant Interactions • Subset of Rosetta compendium used • 28 deletions were TF (red circles) • 355 diff. exp. genes (white boxes) • P < 0.005 • 755 TF-deletion effects (grey squiggles)
Network Measurements • Yeast under normal growth conditions • Promoter binding • ChIP-chip / location analysis Lee, et. al. Science(2002) • Protein-protein interaction • Yeast 2-hybrid Database of Interaction Proteins (DIP) Deane, et. al. Mol Cell Proteomics (2002)
ChIP Measurement of Protein-DNA Interactions (Chromatin Immunoprecipitation)
Step 1: Network connectivity(chIP-chip analysis) ~ 5k genes (white boxes) ~ 20k interactions (green lines)
Step 2: Network annotation(gene expression analysis) Measure variables that are a function of the network (gene expression). Monitor these effects after perturbing the network (TF knockouts). What parts are wired together How and why the parts are wired together the way they are
Inferring regulatory paths = Direct = Indirect
OR Annotate: inducer or repressor
Computational methods • Problem Statement: • Find regulatory paths consisting of physical interactions that “explain” functional relationship • Method: • A probabilistic inference approach • Yeang, Ideker et. al. J Comp Bio (2004) • To assign annotations • Formalize problem using a factor graph • Solve using max product algorithm • Kschischang. IEEE Trans. Information Theory (2001) • Mathematically similar to Bayesian inference, Markov random fields, belief propagation
Inferred Network Annotations A network with ambiguous annotation
Which deletion experiments should we do first? • A mutual information based score • For each candidate experiment (gene ) • Variability of predicted expression profiles • Predict profile for each possible set of annotations • More variable = more information from experiment • Reuse network inference algorithm to compute effect of deletion!
We target experiments to one region of network Expression for: SOK2, HAP4 , MSN4 , YAP6
Expression of Msn4 targets Average signed z-score
Refined Network Model • Caveats • Assumes target genes are correct • Only models linear paths • Combinatorial effects missed • Measurements are for rich media growth
Using this method of choosingthe next experiment • Is it better than other methods? • How many experiments? • Run simulations vs: • Random • Hubs
Simulation results # simulated deletions profiles used to learn a “true” network
Current Work Measurements “Systems level” understanding Treat disease Networks Test & Refine Transcriptional response to DNA damage
Acknowledgments Trey Ideker Craig Mak Chen-Hsiang Yeang Tommi Jaakkola Scott McCuine Maya Agarwal Mike Daly Ideker lab members Tom Begley Leona Samson Funding grants from NIGMS, NSF, and NIH