Management of Net Working Capital: Trends from 2006 to 2010
20 likes | 165 Vues
This report analyzes the management of net working capital (NWC) from 2006 to 2010, highlighting a 5% decrease in NWC compared to 2009. NWC as a percentage of revenues stood at 12.1%, slightly down from 12.7% in Q4 2009. Notably, the reduction in NWC is strategically offsetting an increase in capital expenditures, which amount to 110% of depreciation. The data emphasizes the need for tight control over NWC to maintain financial stability amid rising capital investment.

Management of Net Working Capital: Trends from 2006 to 2010
E N D
Presentation Transcript
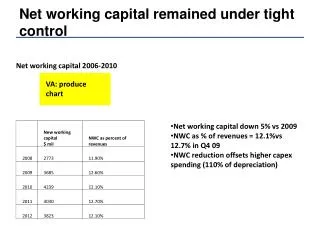
Net working capital remained under tight control Net working capital 2006-2010 VA: produce chart • Net working capital down 5% vs 2009 • NWC as % of revenues = 12.1%vs 12.7% in Q4 09 • NWC reduction offsets higher capex spending (110% of depreciation)
Net working capital remained under tight control Net working capital 2006-2010 Net working capital,$ millions NWC as percentof revenues • Net working capital down 5% vs 2009 • NWC as % of revenues = 12.1%vs 12.7% in Q4 09 • NWC reduction offsets higher capex spending (110% of depreciation) 2