Download
1 / 16
160 likes | 333 Vues
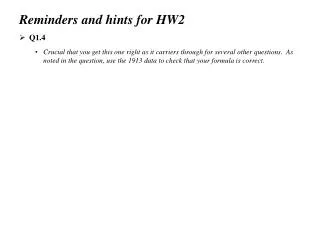
Reminders and hints for HW2 Q1.4 Crucial that you get this one right as it carriers through for several other questions. As noted in the question, use the 1913 data to check that your formula is correct. Reminders and hints for HW2 Q1.4

E N D
Reminders and hints for HW2 • Q1.4 • Crucial that you get this one right as it carriers through for several other questions. As noted in the question, use the 1913 data to check that your formula is correct.
Reminders and hints for HW2 • Q1.4 • Crucial that you get this one right as it carriers through for several other questions. As noted in the question, use the 1913 data to check that your formula is correct. • Q1.5 • Refer to the beginning of HW1 for an example of the “replace” command • The notes provide examples of the command for running an OLS regression • Q1.8 & 1.9 • Pay attention to the required rounding (precision and accuracy are important) • Q1.10 • REALLY pay attention to the required rounding. It is a slight tweak on what is asked for in 1.8 and 1.9. • Q1.11 – 1.13 • Double log model… covered later in the notes
(Original) Empirical Specification: (Alternative) Empirical Specification: Double-Log Specification
Suppose percent. In this case, Interpretation: A 10 percent increase in high school grades is associated, on average, with a roughly 6 percent increase in college grades. Why use double-log? In some cases, it is (1) Easier to interpret, (2) a better fit to the data. More on this later…
Homework question is tricky—you need to do these steps in that case!
Multivariate Model Most important items in a econometrician’s toolbox: “Regression models designed to control for variables that may mask the causal effects of interest.” Mostly Harmless Econometrics, p. xi. where is the student’s cumulative college gpa (1-4). is the student’s high school gpa (1-4). is the student’s combined SAT score (in hundreds of points (ranges from 6.3 to 16). is a stochastic error term • Now a slope coefficient indicates the change in the dependent variable associated with a one-unit increase in the explanatory variable holding the other explanatory variables constant
It is the change in college grades with respect to a change in high school grades holding SAT scores constant. Interpretation: A full-letter grade increase in a student’s high-school grades is associated, on average, with roughly a third of a letter grade increase in their college grades, holding his or her SAT scores constant.
… holding the other explanatory variables constant, not holding everything else constant. Omitted (and relevant) variables are not held constant. How do you graph the relationship between the dependent variable and one of many explanatory variables. To do it, you need to hold the other explanatory variables constant, often at their sample means. Suppose we want to graph the relationship between high school and college grades holding SATs constant at its mean, which is 1302 (). Substituting,
Univariate OLS Fitted line: Multivariate OLS Fitted line: College gpa High school gpa
Decomposition of Variance in g Demonstrate that:
Decomposition of Variance in g TSS = ESS + RSS Dividing both sides by TSS, 1 = Define the coefficient of determination as The proportion of the total variation in the dependent variable that is explained by the independent variables. is a measure of the overall fit of the estimated model.
High school grades consistently predict college freshmen's grades more accurately than the SAT in both selective and nonselective colleges, and little predictive power is gained by combining the SAT with high school grades. William Julius Wilson, The American Prospect, 1999 High school grades alone explains 16.3 percent of the variation in college grades High school grades and SAT scores together explain 25.9 percent of the variation in college grades Our evidence doesn’t support William Julius Wilson’s claim!
How hard a student works in high school is a better indication of their potential as a college student than a test that requires six hours on a Saturday. Editorial, Penn State Daily Collegian, 2008