Comparative Analysis of Protein Expression in Normal and Mastitic Whey and MFGM Fractions
This study presents a comparative analysis of protein expression in whey and MFGM fractions from normal and mastitic milk samples using MALDI-TOF mass spectrometry. Different protein spots were identified, revealing potential biomarkers for mastitis.

Comparative Analysis of Protein Expression in Normal and Mastitic Whey and MFGM Fractions
E N D
Presentation Transcript
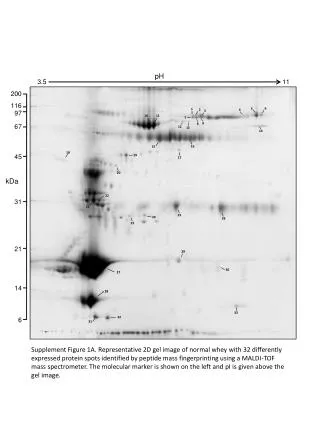
pH 3.5 11 200 116 6 5 1 2 4 3 97 10 11 7 9 8 12 13 67 14 16 15 18 19 17 45 20 kDa 22 31 21 25 24 26 23 21 29 30 27 14 28 33 32 31 6 Supplement Figure 1A. Representative 2D gel image of normal whey with 32 differently expressed protein spots identified by peptide mass fingerprinting using a MALDI-TOF mass spectrometer. The molecular marker is shown on the left and pI is given above the gel image.
pH 3.5 11 34 200 35 48 116 36 42 41 39 40 97 47 37 44 45 43 67 38 46 49 51 56 52 55 50 58 57 45 53 54 59 60 kDa 61 31 62 67 66 65 64 63 21 69 68 76 74 73 71 70 75 72 14 83 79 84 82 78 77 6 81 80 Supplement Figure 1B. Representative 2D gel image of mastitic whey with 51 differently expressed protein spots identified by peptide mass fingerprinting using a MALDI-TOF mass spectrometer. The molecular marker is shown on the left and pI is given above the gel image.
200 85 86 116 90 92 93 97 87 89 91 105 67 88 95 103 98 99 94 97 96 101 100 102 45 104 106 107 kDa 31 108 109 21 113 114 115 111 110 112 116 14 6 Supplement Figure 1C. Representative 2D gel image of normal MFGM with 32 differently expressed protein spots identified by peptide mass fingerprinting using a MALDI-TOF mass spectrometer. The molecular marker is shown on the left and pI is given above the gel image.
200 118 117 116 119 126 97 120 124 127 123 122 121 125 67 129 130 128 133 131 45 132 136 138 140 141 134 135 139 137 142 kDa 143 144 145 146 147 31 150 149 151 148 156 157 21 153 152 158 159 155 154 160 14 161 162 163 6 Supplement Figure 1D. Representative 2D gel image of mastitic MFGM with 46 differently expressed protein spots identified by peptide mass fingerprinting using a MALDI-TOF mass spectrometer. The molecular marker is shown on the left and pI is given above the gel image.
200 164 165 116 166 167 168 169 97 67 170 172 173 171 174 45 175 176 177 178 kDa 179 181 180 31 184 186 183 185 182 21 188 187 14 191 190 189 6 192 Supplement Figure 1E. Representative 2D gel image of normal Basic Fraction with 29 differently expressed protein spots identified by peptide mass fingerprinting using a MALDI-TOF mass spectrometer. The molecular marker is shown on the left and pI is given above the gel image.
pH 3.5 11 193 200 116 194 196 199 201 200 97 195 197 67 203 198 202 205 204 209 206 208 45 210 207 211 kDa 212 31 214 213 215 21 216 238 224 233 234 239 231 240 223 220 225 237 227 235 232 14 217 221 226 236 222 219 230 218 229 228 6 226 Supplement Figure 1F. Representative 2D gel image of mastitic Basic Fraction with 48 differently expressed protein spots identified by peptide mass fingerprinting using a MALDI-TOF mass spectrometer. The molecular marker is shown on the left and pI is given above the gel image.