
EE2372 Software Design with Flowcharts
E N D
Presentation Transcript
EE2372 Software Design with Flowcharts Dr. Jose Gerardo Rosiles Spring 2010 TTh 10:30-11:50 am
Flowcharts • Algorithm: A sequence or series of steps followed to solve a problem or to implement a solution to this problem. • A flowchart is a means of visually presenting the flow or steps taken to implement a computer program. • Flowcharts can be used to visualize algorithms.
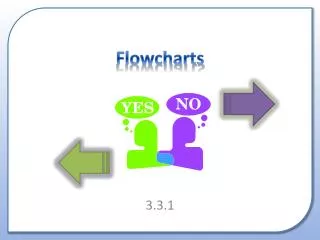
Flowcharts • Start and end program • Processing steps • Input/Output operations • Decision making and branching • Connector • Flow lines Graphical elements used to build flowcharts
Flowcharts • How to link components 1 <0 START DECIDE >0 DO SOMETHING 1 INPUT VALUE NO ==0 DECIDE OUTPUT VALUE DO SOMETHING YES 1 END
Flowcharting Examples • Some examples taken from http://www.nos.org/htm/basic2.htm • See class handout for more details
Example 2 • Draw a flowchart to find the largest of three numbers A,B, and C. • Do on your own, then look at solution. • Find an error in the following possible solution
Example 3 • Draw a flowchart for computing factorial N (N!) where N! = 1 2 3 …… N .
Example 4 • A company’s salesmen are selling toothpaste and tooth powder. The company having 50 salesmen gives 10% commission on the sale of toothpaste and 20% commission on tooth powder. • Draw a flowchart to compute and print the total sale and the total commission for each salesman. Note: S = Salesman number P1 = Amount of sales of paste P2 = Amount of sales of powder K = Counter for the number of salesman
Example 5 • Modify the flowchart in Example 4 to print the following heading. Salesman NoTotal SaleTotal commission Under these heading, write the values of these variables for the 50 salesmen. At the end, the totals of the entire sale and the entire commission should also be printed out. • Hint, use variables: TS = Total sales TC = Total commission
Example 6 • Implement a flowchart to compute
Example 7 • How do hand calculators implement trigonometric functions? • Use approximations by Taylor series (thanks to Wikipedia for the math LaTex expressions). • Draw flowcharts to approximate cosine and sine up to N terms. • Assume you have access to power and factorial functions.