Download
1 / 21
210 likes | 341 Vues
The Kroger Company, headquartered in Cincinnati, Ohio, is one of the largest supermarket chains in the U.S., with more than 326,000 employees and 2,469 grocery stores across 31 states. Founded in 1883 by Bernard Kroger as the Great Western Tea Co., it has evolved into a major player in the retail industry. Kroger operates various chains, 850 fuel centers, and 40 food processing plants. This overview highlights its financial metrics, including liquidity ratios, profitability ratios, and dividend yield, offering insights into its operational efficiency and market performance.

E N D
The Kroger Company Al Renner Jeremy Hilgeford Stephanie Hilgeford
Facts • Headquartered in Cincinnati, Ohio • More than 326,000 employees • 2,469 supermarkets and multi-department stores in 31 states • Operates 850 fuel centers and 40 food processing plants
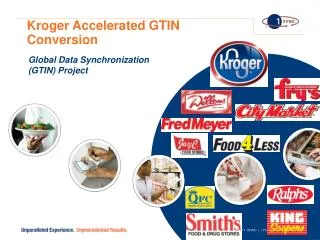
Company History • Founded by Bernard Kroger as the Great Western Tea Co in 1883 • Became Kroger Grocery and Baking Co in 1902 • Operates under dozens of chain names nationwide.
Liquidity and Efficiency WC = Current Assets – Current Liabilities
Liquidity and Efficiency Current Ratio = Current Assets Current Liabilities
Liquidity and Efficiency Acid-Test Ratio = Quick Assets Current Liabilities
Liquidity and Efficiency AR Turnover = Sales on Account Average Accounts Receivable
Liquidity and Efficiency Inventory Turnover = Cost of Good Sold Average Inventory
Liquidity and Efficiency Days’ Sales Uncollected= AR X 365 Net Sales
Liquidity and Efficiency Days’ Sales in Inventory= Ending Inventory X 365 Cost of Goods Sold
Profitability Net Profit Margin Ratio = Net Income Net Sales
Profitability ROTA Ratio = Net Income Average Total Assets
Profitability ROE Ratio = Net Income Average Total Assets
Profitability EPS Ratio = Net Income Avg. # Shares Outstanding
Solvency Liabilities to Assets Ratio = Liabilities Assets
Solvency Cash Flow From Ops to Total Liabilities = CFFO Total Liabilities
Solvency Long-Term Debt Ratio = Long-term Debt Total Equity
Solvency Times Interest Earned Ratio= Net Income BIT Interest Expense
Price-Earnings Ratio Current 52 weeks ago • P/E ratio= Market price per share Earnings per share • =84.96 • Industry Average =140.85 • P/E ratio= Market price per share Earnings per share • =12.1
Dividend Yield • Dividend Yield= Annual Dividends per Share Market Price per Share • = $0.38 / $22.09 = 1.72% • Kroger Dividend per Share=$0.38 • Industry Average=$0.29