Download
1 / 5
50 likes | 175 Vues
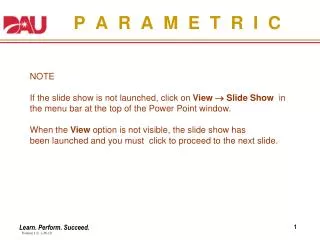
P A R A M E T R I C. NOTE If the slide show is not launched, click on View Slide Show in the menu bar at the top of the Power Point window. When the View option is not visible, the slide show has been launched and you must click to proceed to the next slide.

E N D
P A R A M E T R I C NOTE If the slide show is not launched, click on View Slide Show in the menu bar at the top of the Power Point window. When the View option is not visible, the slide show has been launched and you must click to proceed to the next slide. Version 1.0, 1-26-10
Parametric Tank X $4,500 C O S T 1,700 G R O S S W E I G H T “CLICK” TO CONTINUE… Version 1.0, 1-26-10
Cost Estimating Relationship: develop/determine if there is a relationship between a weapon system parameter (weight/speed) and cost Correlation: a calculation that quantifies the relationship (r2) between two the variables – values above .9 are acceptable. A value of 1.0 is perfect correlation. Standard Deviation: a calculation that determines the distances between the points and a line Regression: a calculation that predicts future occurrences based on the data’s correlation, standard deviation, standard error of the estimate and the value of the independent variable. Parametric (cont.) “CLICK” TO CONTINUE… Version 1.0, 1-26-10
Parametric (cont.) C O S T G R O S S W E I G H T Regression Formula: Y = aX + b Where: Y = Dependent Variable X = Independent Variable a = Slope of the line b = Y intercept “CLICK” TO CONTINUE… Version 1.0, 1-26-10
350– 300– C O S T 250– 200– G R O S S W E I G H T 500 550 600 650 700 750 800 850 900 950 1000 • Y Predicted Y Parametric (cont.) Weight is 675; what is cost? Is there correlation? Yes, r2 > 0.9 Regression Calculation Y = aX + b Y = 0.354713 * 675 + 0.703184 Y = 240 240 r2 = 0.964477 slope = 0.354713 Y intercept = 0.703184 “CLICK” TO CONTINUE… Version 1.0, 1-26-10