Download

1 / 60
620 likes | 801 Vues
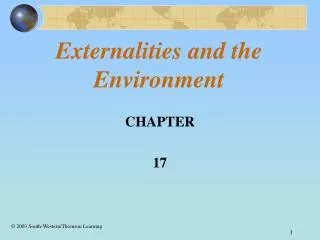
Externalities and the Environment. CHAPTER 17. © 2003 South-Western/Thomson Learning. Introduction. Must begin by distinguishing between exhaustible and renewable resources Exhaustible resource does not renew itself available in a finite amount Coal, oil, etc

E N D
Externalities and the Environment CHAPTER 17 © 2003 South-Western/Thomson Learning
Introduction • Must begin by distinguishing between exhaustible and renewable resources • Exhaustible resource does not renew itself available in a finite amount • Coal, oil, etc • A resource is renewable if, when used conservatively, it can be drawn on indefinitely • Trees, fish, atmosphere, water
Renewable Resources • Some renewable resources are open-access goods • Open-access resource is rival in consumption but exclusion is costly • For example, fish caught in the ocean are not available for others to catch rival in consumption
Renewable Resources • However, it would be difficult for a person or firm to “own” fish still in the ocean and prevent others from catching them exclusion is costly • An open-access good is often subject to the common-pool problem results because people consume a good until the marginal value of additional use drops to zero they are often overused
Renewable Resources • In a market system, specific individuals usually own the rights to resources and therefore have a strong interest in using those resources efficiently • Private property rights allow individuals to use resources or to charge others for their use • Defined and enforced by government, by social actions, and by ethical norms • For open-access resources, specifying and enforcing property rights is costly
Renewable Resources • Pollution and other negative externalities arise because there are no practical, enforceable, private property rights to open-access resources, such as air and water • Market prices usually fail to include the costs that negative externalities impose on society
Resolving the Common-Pool Problem • By imposing restrictions on resource use, government regulations may be able to reduce common-pool problems • Output restrictions or taxes could force firms to use the resources at a rate that is socially optimal • More generally, when imposing and enforcing property rights would be too costly, government regulations may improve allocative efficiency
Resolving the Common-Pool Problem • Not all regulations are equally efficient • For example, the specific regulation may lead each firm to act rationally, but the collective effect of the regulation and their actions is grossly inefficient in terms of social welfare • Exhibit 1 illustrates the problem of negative externalities in the case of fixed-production technology
Here we have the demand for electricity in the Midwest. Recall that a demand curve reflects consumers’ marginal benefit for each level of consumption. Exhibit 1: Negative Externalities: Fixed Technology If producers base their pricing and output decisions on their costs, the equilibrium price and quantity are $0.10 and 50 million kilowatt hours at point a . Marginal social cost $0.14 However, electricity production also involves the external cost of using the atmosphere as a gas dump. Here the marginal external cost imposed on the environment by the generation of electricity is $0.04 per kilowatt-hour a Marginal private cost 0.10 Dollars per kwh D 0 50 35 Millions of kilowatt hours of electricity per month
Exhibit 1: Negative Externalities: Fixed Technology If the only way of reducing emissions is by reducing the generation of electricity, then the relationship between the production of electricity and pollution is a fixed one fixed-production technology. The vertical distance between the marginal private cost curve and the marginal social cost curve shows the marginal external cost. b Marginal social cost $0.14 The marginal social cost includes both the marginal private cost and the marginal external cost that production imposes on society. Note that at the private-sector equilibrium of 50 million kilowatt hours, the marginal social cost, identified at point b, exceeds society’s marginal benefit from that unit of electricity, point a on the demand curve. Marginal external cost a Marginal private cost 0.10 Dollars per kwh D 0 50 35 Millions of kilowatt hours of electricity per month
Exhibit 1: Negative Externalities: Fixed Technology The last kilowatt hour of electricity produced costs society $0.14 but yields a marginal benefit of only $0.10 the firm’s choice of output results in a market failure. c b Marginal social cost $0.14 Too much pollution is produced because the price of electricity fails to reflect the social cost of $0.04 cents per kilowatt hour. Marginal external cost a Marginal private cost 0.10 Dollars per kwh From society’s point of view, the efficient output rate of 35 million kilowatt hours occurs where the demand, or marginal benefit, curve intersects the marginal social cost curve point c. D 0 50 35 Millions of kilowatt hours of electricity per month
Negative Externalities: Fixed Technology • How could output be restricted to the socially efficient level? • If government policy makers knew the demand and marginal cost curves, they could simply restrict electric utilities to produce that optimal level • Alternatively, they could impose a pollution tax on each unit of output equal to the marginal external cost
Negative Externalities: Fixed Technology • In the case of the pollution tax, the marginal private cost curve would shift upward to the marginal cost curve private costs are brought in line with public costs • Thus, setting the tax equal to the marginal external cost results in a level of output that is socially efficient the marginal social cost of production equals the marginal benefit
Exhibit 1: Negative Externalities: Fixed Technology Note that pollution is not eliminated at point c, but the utilities no longer generate electricity whose marginal cost exceeds its marginal benefit. c b Marginal social cost $0.14 The total social cost from reducing production to the socially optimal level is shown by the blue shaded triangle. This triangle also measures the total social cost of ignoring the negative externalities in the production decision. a Marginal private cost 0.10 Dollars per kwh D 0 50 35 Millions of kilowatt hours of electricity per month
Negative Externalities: Variable Technology • The preceding example assumes that the only way to reduce the total amount of pollution is to reduce output • However, power companies can usually change their resource mix to reduce emissions for a given level of output, particularly in the long run • Because pollution can be reduced by altering the production process rather than by simply adjusting the rate of output, these externalities are said to be produced under conditions of variable technology Exhibit 2
Exhibit 2: The Optimal Level of Air Quality However, the production of cleaner air, like the production of other goods, is subject to diminishing returns eliminating successively finer particles which requires more sophistication and more expensive processes the marginal social cost curve slopes upward. Marginal social benefit Marginal social cost Dollars per unit Air quality can be improved by adopting cleaner production technology. The marginal social benefit curve reflects the additional benefit society derives from improving air quality. Cleaner air, like all other goods, has a declining marginal benefit to society curve slopes downward. Poor A' A Excellent Air quality
Exhibit 2: The Optimal Level of Air Quality The total social waste associated with imposing a greater-than-optimal level of air quality is shown by the pink shaded triangle, abc. The optimal level of air quality for a given level of production is found at point a, where the marginal social benefit of cleaner air equals the marginal social cost. Marginal social benefit Marginal social cost Firms would not reach this level voluntarily. That is, if firms made their production decisions based simply on their private costs they would have no incentive to search for production methods that reduce pollution too much pollution would occur. Dollars per unit c a What if the government decrees that the level of air quality should exceed A? For example, suppose a law sets A' as the minimum acceptable level the marginal social cost, identified as c, of achieving that level of clean air exceeds the benefit, identified as b. b Poor A' A Excellent Air quality
Negative Externalities: Variable Technology • Thus, the idea that all air pollution should be eliminated is a popular misconception • Some pollution is consistent with efficiency improving air quality benefits society as a whole as long as the marginal benefit of cleaner air exceeds its marginal cost • What would happen to the optimal level of air quality if either the marginal cost or the marginal benefit changed Exhibit 3
Exhibit 3: Effect of Changes in Costs a) Lower cost of air quality Suppose, for example, that some technological breakthrough occurs that reduces the marginal cost of cleaning the air as shown by the shift in the marginal social cost curve to MSC'. The net effect is to increase the optimal level of air quality from A to A' the lower the marginal cost of reducing pollution, other things constant, the greater the optimal level of air quality. Marginal social benefit Marginal social cost Dollars per unit MSC' Air quality 0 A A'
Exhibit 3: Effect of Changes in Benefits b) Greater benefits of air quality An increase in the marginal benefit of air would have a similar effect. The increase in the marginal benefit is shown by the shift upward in the marginal social benefit curve to MSB' the optimal level of air quality would increase the greater the marginal benefit of cleaner air, other things constant, the greater the optimal level of air quality. Marginal Social benefit MSB' Marginal social cost Dollars per unit Air quality 0 A A"
The Coase Theorem • The traditional analysis of externalities assumes that market failures arise because people ignore the external effects of their actions • Consider the following example • A research laboratory that tests delicate equipment locates next to a manufacturer of heavy machinery • The vibrations caused by the manufacturing process throw off the delicate machinery in the lab
The Coase Theorem • Coase pointed out that the negative externality in this case is not necessarily imposed by the machinery producer on the testing lab • Rather, it arises from the incompatible activities of the two parties the externality is the result both of vibrations created by the factory and of the location of the testing lab next door
The Coase Theorem • There are two efficient solutions in this situation • Modify the machines in the factory, or • Move the lab elsewhere • According to Coase, the efficient solution depends on which party can avoid the problem at the lower cost
The Coase Theorem • Suppose the following • The factory determines that it would cost $2 million to reduce vibrations enough to allow the lab to function normally • The testing lab concludes that it cannot alter its equipment to reduce the effects of the vibrations its only recourse is to move at a cost of $1 million • Thus, the least-cost, or most efficient resolution to the externality problem is for the testing lab to relocate
The Coase Theorem • Coase argued that when property rights are assigned to one party or another, the two parties will agree on the efficient solution to an externality problem as long as the transaction costs are low the efficient solution will be achieved regardless of which party gets the property rights
The Coase Theorem • Suppose the testing lab is granted the right to operate free of vibrations it has the right to ask the factory to reduce its vibrations • Rather than cut vibrations at a cost of $2 million, the factory can offer to pay the lab to relocate • Any payment by the factory owners that is greater than $1 million but less than $2 million will make both better off the lab will move, which is the efficient outcome
The Coase Theorem • Alternatively, suppose the factory is granted the right to generate vibrations regardless of any effects on the testing lab business as usual • The lab may consider paying the factory to alter its production method, but since the minimum payment the factory would accept is $2 million, the lab would rather move at a cost of $1 million
The Coase Theorem • Thus, whether property rights are granted to the lab or to the factory, the lab will move which is the most efficient solution • Note • Regardless of who is given the property rights, an efficient outcome results • A particular assignment of property rights determines only who incurs the externality cost not the efficient outcome
Markets for Pollution Rights • The primary implication of the Coase Theorem is that assignment of property rights is often sufficient to resolve the market failure associated with externalities no further government intervention is necessary • If pollution can be easily monitored and polluters easily identified, the government may be able to achieve an efficient solution to the problem of pollution simply by assigning the right to pollute
Markets for Pollution Rights Consider the following example: • Firms that dump waste into a river evidently value the ability to discharge waste in this fashion provides an inexpensive outlet for pollutants that would have to be disposed of at a greater cost • The river provides disposal services, and the demand curve for this pollutant the demand curve slopes downward Exhibit 4
Exhibit 4: Optimal Allocation of Pollution Rights The demand for the river as a discharge system is D measures the marginal value to firms of using the river as a resource for discharging pollutants. With no restrictions on river pollution, dumping would continue as long as it yields some private benefits 250 tons per day. S 35 Dollars per ton 25 The river can absorb and neutralize a certain amount of pollution per day without deteriorating in quality. Suppose engineers determine this level of water quality can be maintained as long as no more than 100 tons are discharged per day the “supply” of the river available as a discharge resource must be fixed at 100 tons per day vertical supply curve S. D 100 250 0 Tons of discharge per day
Exhibit 4: Optimal Allocation of Pollution Rights If government regulators can easily identify polluters and monitor their behavior, authorities can allocate permits to discharge 100 tons per day. If polluters are simply given these permits (the price of these permits is zero) there will be an excess demand for them, since the quantity supplied is 100 tons but the quantity demanded at a zero price is 250 tons. S 35 Dollars per ton 25 An alternative is to sell 100 tons of pollution permits at the market-clearing price, which in our example would yield a permit price of $25 per ton which is the marginal value of dumping the 100th ton into the river each day. To most purchasers, the marginal value of a permit will exceed $25 per ton. D 100 250 0 Tons of discharge per day
Markets for Pollution Rights • The beauty of this system is that producers who value the discharge rights the most will ultimately end up with them • Producers who attach a lower marginal value obviously have cheaper ways of resolving their waste problems • And if conservation groups want a higher quality than the government’s standard, such as waste clean enough to drink, they can purchase the pollution permits
Exhibit 4: Optimal Allocation of Pollution Rights S What if additional firms spring up along the river and want to discharge wastes? This added demand is shown by D'. This increase in demand would bid up the market price of pollution permits to $35 a ton. Some existing permit holders will sell their rights to those who value them more. 35 Dollars per ton 25 D' D 100 250 0 Tons of discharge per day
Markets for Pollution Rights • If the right to pollute could be granted, monitored, and enforced, then what had been a negative externality problem could be solved through market allocation • In 1989, a pollution-rights market for fluorocarbon emissions was established and was followed in 1990 by a market for sulfur dioxide and during the 1990s sulfur-dioxide emissions fell by more than half
Markets for Pollution Rights • Unfortunately, legislation dealing with pollution is affected by the same problems of representative democracy that trouble other public policy questions • Polluters have a special interest in government proposals relating to pollution they fight measures to reduce pollution
Markets for Pollution Rights • However, members of the public remain rationally ignorant about pollution legislation • So pollution regulations may be less in accord with the public interest than with the special interests of polluters • This is why a portion of pollution permits are often given free to existing firms
Markets for Pollution Rights • Prior to 1990, traditional command-and-control environmental regulations were the norm • This approach required polluters to introduce particular technologies to reduce emissions by specific amounts • These regulations were based on engineering standards and did not recognize unique circumstances across generating plants
Markets for Pollution Rights • Economic efficiency approach • Reflected by the pollution rights approach • Offers each polluter the flexibility to reduce emissions in the most cost-effective manner given its unique costs • Firms with the lowest emission control costs have an incentive to implement the largest reduction in emissions, and then sell unused allowances to those with greater control costs
Environmental Protection • Environmental Protection Agency, EPA, coordinates federal efforts to address common-pool problems • Four federal laws and subsequent amendments underpin U.S. efforts • The Clean Air Act of 1970 • The Clean Water Act of 1972 • The Resource Conservation and Recovery Act of 1976 which governs solid waste disposal • The Superfund law of 1980 focusing on toxic waste dumps
Environmental Protection • Compliance with pollution-control regulations costs U.S. producers and consumers an amount equivalent to 2% of gross domestic product • Pollution-abatement spending can be divided into three categories • Spending for air-pollution abatement: 40% toward cleaner air • Spending for water-pollution abatement: 40% toward cleaner water • Spending for solid waste disposal: 20%
Air Pollution • In the Clean Air Act of 1970, Congress set national standards for the amount of pollution that could be emitted into the atmosphere recognized the atmosphere as an economic resource with alternative uses • Smog is the most visible form of air pollution • Automobile emissions account for 40% of smog • 40% from consumer products • 15% from manufacturing
Air Pollution • Despite recent improvements in air quality, the United States is still a major source of carbon dioxide emissions • Kyoto accord would require the 38 industrial countries to reduce emissions by one-third over ten years cost to U.S. of $300 billion a year • Problem is that this accord requires nothing from developing countries like China and India which are major polluters • Exhibit 5 shows the world’s twenty worst nations in carbon dioxide emissions
Water Pollution • Two major sources of water pollution • Sewage • For decades, U.S. cities had an economic incentive to dump their sewage directly into waterways • Federal money over the years has funded sewage treatment plants that have cut water pollution substantially nearly all cities now have modern sewage control systems • New York City is the exception and still dumps raw sewage into the Atlantic Ocean • Chemicals • 10% comes from point pollution pollution from factories and other industrial sites • Two-thirds comes from nonpoint pollution runoff from agricultural pesticides and fertilizers
Water Pollution • The EPA has turned pesticide regulation over to the states which gave the job to their departments of agriculture • However, these state agencies usually promote the interests of farmers, not restrict what they can do • The EPA now reports that pesticide residues on food pose more health problems than do toxic waste dumps or air pollution
Hazardous Waste and the Superfund • The chemicals posed by the synthetic chemical industry occur at every stage in their production, use, and disposal • New Jersey manufactures more toxic chemicals than any other state and has the worst toxic waste burden • Prior to 1980, once a company paid someone to haul away its hazardous waste, the company was no longer responsible
Hazardous Waste and the Superfund • The Comprehensive Environmental Response, Compensation, and Liability Act of 1980 – Superfund law – now requires any company that generates, stores, or transports hazardous wastes to clean up any wastes that are improperly disposed of • Gives the federal government authority over sites contaminated with toxins
Hazardous Waste and the Superfund • To get an offending company to comply, the EPA frequently must sue • This process is slow, and nearly half the budget goes to lawyers, consultants and administrators rather than to site cleanups • The law did not require that benefits exceed costs or even that such comparisons be attempted
Hazardous Waste and the Superfund • Although billions have been spent so far, an EPA study concluded that the health hazards of Superfund sites have been vastly exaggerated • Because of their greater political urgency and media appeal, toxic waste dumps tend to receive more attention and air or water pollution