Download
1 / 23
230 likes | 327 Vues
Delve into statistics on women in science across European countries, revealing gender imbalances and challenges women researchers face. Understand the implications and calls for more research on gender equality.

E N D
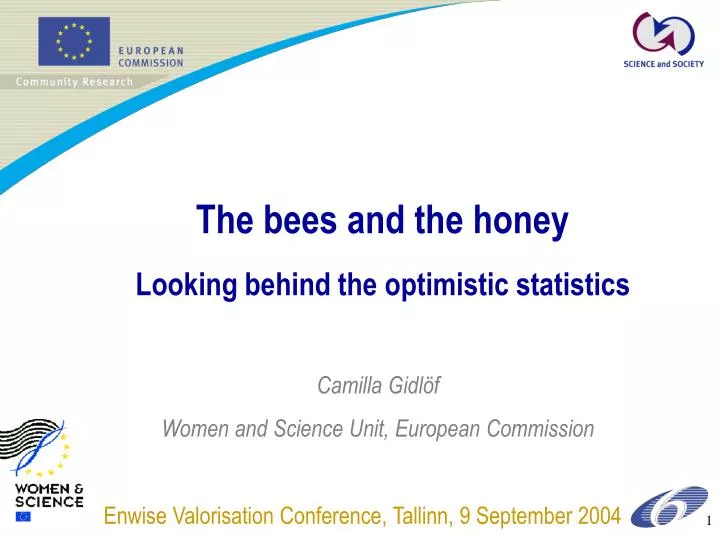
The bees and the honey Looking behind the optimistic statistics Camilla Gidlöf Women and Science Unit, European Commission Enwise Valorisation Conference, Tallinn, 9 September 2004
R&D Statistics in the Enwise countries • ETAN-report and Helsinki Group of Women and Science identified the need for statistics on women's participation in science in Europe • Statistical Correspondents established in 2000 • Enwise countries involved in these two groups from the start • Statistics generally of good quality in Enwise countries
Percentage of women researchers Germany: 15% women researchers % women Latvia 52% Lithuania 47% Bulgaria 46% Portugal 44% Estonia 43% Romania 43% Greece 41% Slovak Republic (1) 40% Sweden 38% Poland 38% Slovenia 36% United Kingdom 35% Spain 35% Hungary 33% Belgium (3) 30% Luxembourg (2) 30% Ireland 29% Finland 28% Italy 27% Netherlands (1) 27% France 27% Czech Republic 27% Denmark 26% Austria 19% Germany (1) 15% gender balance 40-59% women Latvia: 52% women researchers gender imbalance 20-39% women Footnotes: (1) FTE as exception to HC: DE; IE (GOV + BES); NL (HES); SE (GOV); SK (2) Data provisional (3) Data not official major gender imbalance < 20 % women Reference year:2000 (EU-15) and 2001 (Enwise countries) Exceptions to reference years: EU-15: BE: 2001; DK (BES), DE (BES), EL, ES (BES), IE (GOV & BES), PT, SE (GOV): 1999; AT: 1998 Data missing: BE, NL (GOV & BES missing); LU, SE, UK (BES missing).
Women researchers in the Enwise countries plus France, Finland & Portugal in 2001 (HC)
R&D expenditure per capita researcher by field of science, Euros per annum, HES + GOV, 2000
R&D expenditure per capita researcher by field of science, Euros per annum, HES + GOV, 2000
R&D expenditure per capita researcher by field of science, Euros per annum, HES + GOV, 2000
R&D expenditure per capita researcher by sector, Euros per annum,2001
Percentage of women researchers (headcount) compared to R&D expenditure per capita researcher (women & men) per annum Reference year: EU-15: 2000, Enwise countries: 2001 Source: Eurostat S&T statistics, * FTE as exception to HC
Correlation between Honeypot scores by sector and Gross expenditure on R&D per capita Researcher, 2001
Gender Pay Gap Lithuania: Monthly Gross Earnings 2001 Slovak Republic: Women´s salaries as a percentage of men´s salaries
Particular characteristics of the context of R&D in Enwise countries that can be seen in the statistics • Higher representation of women among researchers than EU-15 • Slightly higher participation of women in the labour force than in EU-15 • Much higher proportions of women among Professionals (ISCO-2 ) than EU-15 • Apart from Poland, Hungary and Romania populations, labour forces and research populations relatively small • R&D expenditure in absolute terms and per capita researcher far lower than in EU-15 in all countries except Slovenia
What did we learn? • Higher representation of women does not necessarily mean less inequality • Unequal access for women researchers to R&D funds • Need more information on gender pay gap “OK ladies! Now those who vote for the future should raise their hands!” Source: Lendvai, Ildikó (2002). ’Women on the stage and in the audience of politics’, Népszabdság, 01.02.2002, Budapest