Centrality in Social Networks
410 likes | 644 Vues
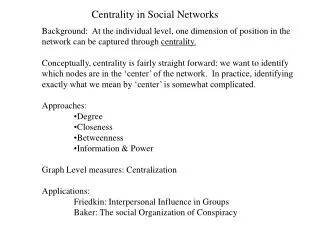
Centrality in Social Networks. Background: At the individual level, one dimension of position in the network can be captured through centrality.

Centrality in Social Networks
E N D
Presentation Transcript
Centrality in Social Networks • Background: At the individual level, one dimension of position in the network can be captured through centrality. • Conceptually, centrality is fairly straight forward: we want to identify which nodes are in the ‘center’ of the network. In practice, identifying exactly what we mean by ‘center’ is somewhat complicated. • Approaches: • Degree • Closeness • Betweenness • Information & Power • Graph Level measures: Centralization • Applications: • Friedkin: Interpersonal Influence in Groups • Baker: The social Organization of Conspiracy
Intuitively, we want a method that allows us to distinguish “important” actors. Consider the following graphs:
The most intuitive notion of centrality focuses on degree: The actor with the most ties is the most important:
One often standardizes the degree distribution, by the maximum possible (g-1):
If we want to measure the degree to which the graph as a whole is centralized, we look at the dispersion of centrality: Simple: variance of the individual centrality scores. Or, using Freeman’s general formula for centralization:
Degree Centralization Scores Freeman: 0.0 Variance: 0.0 Freeman: 1.0 Variance: 3.9 Freeman: .02 Variance: .17 Freeman: .07 Variance: .20
Degree Centralization Scores Freeman: 0.1 Variance: 4.84
A second measure of centrality is closeness centrality. An actor is considered important if he/she is relatively close to all other actors. Closeness is based on the inverse of the distance of each actor to every other actor in the network. Closeness Centrality: Normalized Closeness Centrality
Closeness Centrality in the examples Distance Closeness normalized 0 1 1 1 1 1 1 1 .143 1.00 1 0 2 2 2 2 2 2 .077 .538 1 2 0 2 2 2 2 2 .077 .538 1 2 2 0 2 2 2 2 .077 .538 1 2 2 2 0 2 2 2 .077 .538 1 2 2 2 2 0 2 2 .077 .538 1 2 2 2 2 2 0 2 .077 .538 1 2 2 2 2 2 2 0 .077 .538 Distance Closeness normalized 0 1 2 3 4 4 3 2 1 .050 .400 1 0 1 2 3 4 4 3 2 .050 .400 2 1 0 1 2 3 4 4 3 .050 .400 3 2 1 0 1 2 3 4 4 .050 .400 4 3 2 1 0 1 2 3 4 .050 .400 4 4 3 2 1 0 1 2 3 .050 .400 3 4 4 3 2 1 0 1 2 .050 .400 2 3 4 4 3 2 1 0 1 .050 .400 1 2 3 4 4 3 2 1 0 .050 .400
Closeness Centrality in the examples Distance Closeness normalized 0 1 2 3 4 5 6 .048 .286 1 0 1 2 3 4 5 .063 .375 2 1 0 1 2 3 4 .077 .462 3 2 1 0 1 2 3 .083 .500 4 3 2 1 0 1 2 .077 .462 5 4 3 2 1 0 1 .063 .375 6 5 4 3 2 1 0 .048 .286
Closeness Centrality in the examples Distance Closeness normalized 0 1 1 2 3 4 4 5 5 6 5 5 6 .021 .255 1 0 1 1 2 3 3 4 4 5 4 4 5 .027 .324 1 1 0 1 2 3 3 4 4 5 4 4 5 .027 .324 2 1 1 0 1 2 2 3 3 4 3 3 4 .034 .414 3 2 2 1 0 1 1 2 2 3 2 2 3 .042 .500 4 3 3 2 1 0 2 3 3 4 1 1 2 .034 .414 4 3 3 2 1 2 0 1 1 2 3 3 4 .034 .414 5 4 4 3 2 3 1 0 1 1 4 4 5 .027 .324 5 4 4 3 2 3 1 1 0 1 4 4 5 .027 .324 6 5 5 4 3 4 2 1 1 0 5 5 6 .021 .255 5 4 4 3 2 1 3 4 4 5 0 1 1 .027 .324 5 4 4 3 2 1 3 4 4 5 1 0 1 .027 .324 6 5 5 4 3 2 4 5 5 6 1 1 0 .021 .255
Closeness Centralization Scores Centralization variance Index Star: 1.0 .02 Circle: 0.0 0.0 Line: 0.28 .006 Group-3 0.36 .005 Grid 0.18 .003
Graph Theoretic Center (Barry or Jordan Center). Identify the points with the smallest, maximum distance to all other points. Value = longest distance to any other node. The graph theoretic center is ‘3’, but you might also consider a continuous measure as the inverse of the maximum geodesic
Betweenness Centrality: Model based on communication flow: A person who lies on communication paths can control communication flow, and is thus important. Betweenness centrality counts the number of geodesic paths between i and k that actor j resides on. b a C d e f g h
a b c d d d e e e f f g g g f h k h k h k i l i l i l j m m j m j m j j m Betweenness Centrality: a b c
Betweenness Centrality: Where gjk = the number of geodesics connecting jk, and gjk = the number that actor i is on. Usually normalized by:
Betweenness Centrality: Centralization: 1.0 Centralization: 0 Centralization: .59 Centralization: .31
Betweenness Centrality: Centralization: .183
Information Centrality: It is quite likely that information can flow through paths other than the geodesic. The Information Centrality score uses all paths in the network, and weights them based on their length.
Bonacich Power Centrality: Actor’s centrality (prestige) is equal to a function of the prestige of those they are connected to. Thus, actors who are tied to very central actors should have higher prestige/ centrality than those who are not. • a is a scaling vector, which is set to normalize the score. • b reflects the extent to which you weight the centrality of people ego is tied to. • R is the adjacency matrix (can be valued) • I is the identity matrix (1s down the diagonal) • 1 is a matrix of all ones.
Bonacich Power Centrality: The magnitude of b reflects the radius of power. Small values of b weight local structure, larger values weight global structure. If b is positive, then ego has higher centrality when tied to people who are central. If b is negative, then ego has higher centrality when tied to people who are not central. As b approaches zero, you get degree centrality.
Bonacich Power Centrality: b=.23 b=-.23
Bonacich Power Centrality: b=-.35 b=.35
Bonacich Power Centrality: b=-.23
Total Effects Centrality (Friedkin). Very similar to the Bonacich measure, it is based on an assumed peer influence model (which we will go over next meeting). The formula is: Where W is a row-normalized adjacency matrix, and a is a weight for the amount of interpersonal influence
Noah Friedkin: Structural bases of interpersonal influence in groups • Interested in identifying the structural bases of power. In addition to resources, he identifies: • Cohesion • Similarity • Centrality • Which are thought to affect interpersonal visibility and salience
Noah Friedkin: Structural bases of interpersonal influence in groups • Cohesion • Members of a cohesive group are likely to be aware of each others opinions, because information diffuses quickly within the group. • Groups encourage (through balance) reciprocity and compromise. This likely increases the salience of opinions of other group members, over non-group members.
Noah Friedkin: Structural bases of interpersonal influence in groups • Structural Similarity • Two people may not be directly connected, but occupy a similar position in the structure. As such, they have similar interests in outcomes that relate to positions in the structure. • Similarity must be conditioned on visibility. P must know that O is in the same position, which means that the effect of similarity might be conditional on communication frequency.
Noah Friedkin: Structural bases of interpersonal influence in groups • Centrality • Central actors are likely more influential. They have greater access to information and can communicate their opinions to others more efficiently. Research shows they are also more likely to use the communication channels than are periphery actors.
Noah Friedkin: Structural bases of interpersonal influence in groups • Substantive questions: Influence in establishing school performance criteria. • Data on 23 teachers • collected in 2 waves • Dyads are the unit of analysis (P--> O): want to measure the extent of influence of one actor on another. • Each teacher identified how much an influence others were on their opinion about school performance criteria. • Cohesion = probability of a flow of events (communication) between them, within 3 steps. • Similarity = pairwise measure of equivalence (profile correlations) • Centrality = TEC (power centrality)
Noah Friedkin: Structural bases of interpersonal influence in groups + + + Find that each matter for interpersonal communication, and that communication is what matters most for interpersonal influence.
Baker & Faulkner: Social Organization of Conspiracy Questions: How are relations organized to facilitate illegal behavior? They show that the pattern of communication maximizes concealment, and predicts the criminal verdict. Inter-organizational cooperation is common, but too much ‘cooperation’ can thwart market competition, leading to (illegal) market failure. Illegal networks differ from legal networks, in that they must conceal their activity from outside agents. A “Secret society” should be organized to (a) remain concealed and (b) if discovered make it difficult to identify who is involved in the activity The need for secrecy should lead conspirators to conceal their activities by creating sparse and decentralized networks.
From an individual standpoint, actors want to be central to get the benefits, but peripheral to remain concealed. They examine the effect of Degree, Betweenness and Closeness centrality on the criminal outcomes, based on reconstruction of the communication networks involved. At the organizational level, they find decentralized networks in the two low information-processing conspiracies, but high centralization in the other. Thus, a simple product can be organized without centralization. At the individual level, that degree centrality (net of other factors) predicts verdict,
Secrecy High Low Decentralized Centralized Low Information Centralized Decentralized High