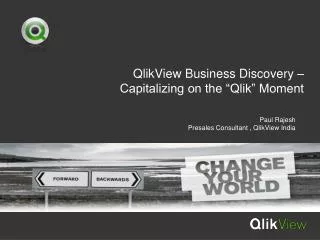
Empower Decision-Making with QlikView BI Software
Explore the key features, benefits, and history of QlikView BI solution. Learn why QlikView is revolutionary & see how it differs from other tools. Discover its platform & step-by-step procedures here.


Empower Decision-Making with QlikView BI Software
E N D
Presentation Transcript
Contents • What is QlikView? • A Brief History About QlikView • Key Features and Benefits • How QlikView is Different with Other Tools • The QlikView Platform • Step-by-Step Procedure • How QlikView Works: A Quick Look Under the Covers • Types of Platform on Which we can View the File About QlikView
What is QlikView? • It is a business intelligence (BI) solution that delivers enterprise-class analytics and search. QlikView empowers users to make the right decisions at any time and puts knowledge at their fingertips wherever they are. • Its in-memory associative search technology makes calculations in real-time, enabling business professionals to gain insight through data exploration • Analysis can be taken entirely off-line on a laptop and remains fully functional. Results can be printed as reports, saved as Adobe PDFs, sent to Microsoft Excel or copied into other Microsoft Office applications. QlikView works the way users work. QlikView is a complete software suite for business analysis. It is quick-to-deploy, easy-to-learn, and easy-to-use. QlikView is based on single architecture to cover all types of analysis and reporting needs for all organizations. QlikView’s patented technology never restricts the end user in the pursuit of knowledge hidden in operational system data. QlikView easily scales to meet the needs of any organization. QlikView is revolutionary and introduces new rules in business analysis. About QlikView
A Brief History About QlikView • QlikTech was established in Sweden in 1993. The company was founded by Björn Berg and Staffan Gestrelius to create software that mimics the way the brain works • At First the tool was called QuikView. “Quik” stood for “Quality, Understanding, Interaction, Knowledge”, later in 1996, the application was named QlikView to emphasize its ability to provide detailed data analysis with a single click • The company which stated with just 35 employees and a couple of million dollar in 1999 now has over 650 people in 24 countries, it has over 1,100 partners worldwide and user base has expanded to 22,000 customers in 100 countries and As of April 2011, the company was valued at over $2 billion • Last year QlikTech's revenues grew 50%, to $120 million, and it expects similar growth in the next years About QlikView
Key Features and Benefits Quick-to-deploy, easy-to-learn, easy-to-use • QlikView requires little to no end user training. End users are able to use QlikView applications in minutes, resulting in fast deployment and reduced costs. Once familiar with the benefits of QlikView users find it hard work without them Single architecture for analysis, applications, and reporting • QlikView provides a single architecture to meet all your data analysis needs. By carefully controlling user rights, organizations can deploy ad-hoc analysis to power users, printable reports to remote users, dashboard metrics to executives, and analytic applications to middle managers. This unified architecture provides all users a single version of the truth – from key performance indicators to the underlying detailed data QlikView always provides an answer • QlikView never restricts users. Every object in QlikView – from lists, to graphs, to tables – is clickable. All objects interact so that a selection in one affects the others. Query results are revealed instantly through intuitive color coding; selected values are highlighted green, linked values are highlighted white, and excluded values are highlighted gray. With each click the user learns exactly what data is available, what data is excluded, and how selections affect summary metrics. QlikView gives users the power to find their own path to insight Integrates all data for analysis • QlikView handles the integration of virtually all existing data formats – from standard relational data, to text exports, to Microsoft Excel data, to XML streams. Data is loaded, cleansed, and stored using a wizard driven ETL script. QlikView adapts to the company’s existing environment not the other way around. Whether data is stored in data warehouses or operational systems, it is always available for use in QlikView applications. About QlikView
How QlikView is Different with Other Tools • QlikView manages associations among data sets at the engine level, not the application level, by storing individual tables in its in-memory associative engine. Every data point in the analytic dataset is associated with every other data point in the dataset. Datasets can be hundreds of tables with thousands of fields. • Unlike traditional query-based tools, when the QlikView user selects a data point, no queries are fired. Instead, all the other fields filter and re-aggregate themselves based on the user’s selection. Selections are highlighted in green. Datasets related to the selection are highlighted in white. Unrelated data is highlighted in gray. This provides a very intuitive, user-friendly way for people to navigate their data on their way to business insight About QlikView
The QlikView Platform About QlikView
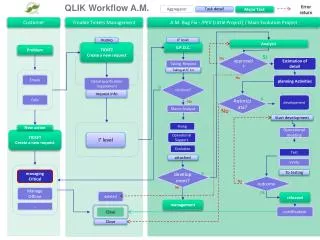
Step-by-Step Procedure • Load raw data into QlikView • QlikView can extract and combine data from multiple, disparate sources without explicitly importing data from, or exporting it to, external systems. This enables centralized analysis of enterprise data regardless of where it originated, providing users with a holistic view of the business. QlikView can consolidate data from many different sources including: • ODBC- or OLEDB-compliant databases, open database connectivity (ODBC) or object linking and embedding database (OLEDB) standards. These include Oracle Database, Microsoft SQL Server, IBM DB2, MySQL, and others and also Standard file formats (e.g., HTML, Microsoft Excel, text, XML, etc.). QlikView also offers specialized connectors for reading data from SAP and Salesforce.com, as well as a custom data interface for extracting data from non-ODBC compliant databases. • Load scripts define data sources • QlikView load scripts define data sources as well as which data will be extracted from sources. These scripts also define what transformations, if any, should be applied to the data as it is loaded. While QlikView in and of itself is not a standalone extract, transform, and load (ETL) tool, QlikView’s out-of-the-box ETL functionality is rich and powerful, with more than 350 functions for transforming data. • Visualizations turn numbers into pictures • QlikView provides flexible, intuitive, and powerful data visualizations (see previous fig). Once data has been extracted from source systems and transformed as needed, developers and designers use QlikView Developer to define which visualizations end users will ultimately interact with in the process of answering important business questions. About QlikView
How QlikView Works: A Quick Look Under the Covers • When a QlikView document is published on a QlikView Server, the content it contains becomes available for consumption by any user with privileges to access it. QlikView works like this: • When a user first opens a QlikView document, data is loaded in memory. The compressed and unaggregated dataset is loaded off the disk and into the QlikView Server’s RAM (random access memory). This in-memory repository serves as the base dataset for this initial user and all other users requesting the same document. This repository stays in memory until no user activity has occurred within a defined time-out period. • Users explore data via selections. Central to QlikView is the concept of a user-defined selection state. As users click around in a QlikView document, they indicate which subsets of data they are interested in analyzing and which subsets should be ignored. QlikView takes advantage of the highly indexed nature of the un-aggregated dataset. QlikView dynamically presents a subset of all the data available to the QlikView document based on the selection state. This happens in real time as the user executes clicks. • Upon selection, on the fly, QlikView automatically changes user interface objects: charts, graphs, tables, etc. Users interact with objects in QlikView documents through any supported client. Users can create their own objects using the collaboration features of QlikView. About QlikView
Types of Platform on Which we can View the File • Business users get improved usability. For small-screen devices such as Apple iPhone and Android Phone, small screen mode (sometimes called single object display mode) delivers a more intuitive user experience without the need for developers to rebuild applications. About QlikView
The Functionality and The Limitations The Functionality The Limitations About QlikView
Useful On-line QlikView Demo’s • Social Media Analysis: http://www.qvsource.com/Live-QVSource-Powered-TIQ-Sentival-Demo • Google Analytics Geography: http://www.qvsource.com/Live-QVSource-Powered-Web-Presence-Analyzer-from-Visual-Data-Group About QlikView


![[PDF] Qlik Sense Business Analyst (QSBA2019) Certification](https://cdn5.slideserve.com/10002693/how-to-prepare-for-qlik-sense-business-analyst-dt.jpg)