Download
1 / 53
530 likes | 586 Vues
Analyze the US healthcare system in comparison with others to determine its quality, value, and cost factors. Explore different healthcare structures and apply lessons learned to propose changes.

E N D
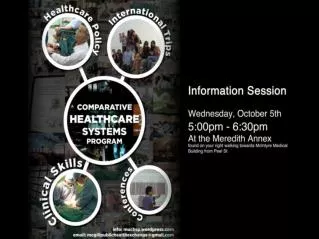
Comparative HealthcareSystems Explore the US Healthcare System and compare it with other Healthcare Systemsto identify what can we learn Michael Teasdale OLLI
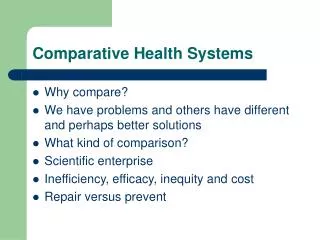
Objectives of this course • Compare the performance of USA health system with others to build an understanding of the relative quality of the US healthcare system • Explore if the USA is getting optimal value from its Healthcare System by analyzing cost, service, access and outcomes • Explore why does the US system cost so much and identify the drivers of high HC cost in the USA • Explore other Healthcare systems structure and mechanisms • Draw lessons and apply them to current proposals for change
Today’s Road Map • What is a healthcare system? How do they develop? • Comparing Healthcare Systems • Comparative Cost • Comparative Service and Access • Comparative Quality and Outcomes • Does the USA healthcare system delivery Value? Some key data to provide a quantitative overview and analysis
Data Sources • Organization for Economic Cooperation and Development (OECD) • Healthcare Status Report, 2015 • Healthcare Quality Indicators Project, 2014 • World Heath Organization (WHO), various papers and data • The Commonwealth Fund Survey, 2006, 2010, 2015 • McKinsey Report on Healthcare Spending in USA, 2008 • Various articles - AtulGawande (New Yorker), Time magazine (Steven Brill), Lancet
Limits to Data and HC comparability • Limitations of Measuring Health Care System data due to data definition and robustness: cultural differences, definitions of data, adjustments for acuity or severity or lack thereof, etc. • Confounding factors: educational levels, environmental hazards, housing, nutritional status and diet, homicide rates, lifestyles • Adversely affected by new disease (e.g. HIV/AIDS) or civil unrest Despite issues with data, major trends appear with some confidence
Definitions of a Healthcare System • The combination of healthcare institutions, supporting human resources, financing mechanisms, organizational structures that link institutions, information systems, and resources and management structures that collectively culminate in the delivery of healthcare services to patients – Lassey, Lassey and Jinks Healthcare systems permeate society and represent a large part of the economy: We ain’t just talking hospitals, nurses and doctors
National Environment and Healthcare • All healthcare systems function in a physical, economic, historical and cultural environment • General physical environment and climate • Socio-economic factors: income levels and distribution, education and knowledge of hygiene • History and historical values - a sense of “solidarity” or individualism • Political and cultural ideals expressing norms and values • Cultural, Family and Individual factors: personality, genetic make-up, life style, diet, use of tobacco, alcohol use, exercise, mental health, etc. Healthcare Systems are born from their environment and history
Healthcare Systems and their Origins • Britain: solidarity and WWII • Tradition of hospitals funded by altruistic individuals or workhouses (1834) funded by local taxes, then compulsory trade union or fraternal societies coverage (prepaid health plans); slow evolution to government funded (Downton Abbey) first locally • Burden of care for wartime casualties led to the creation of a national systemmade law by National Health Service Act in 1948 • France: egalitarianism and liberalism (free market) • Medical profession built charters and standards of care 1927 • Nation health insurance laws of 1928/1945/1967 built on local tradition of local sickness funds, established by guilds and professional organizations • French system continues a mix of private and public system. • USA: individualism and the need attract workers • Large hospitals, largely funded by charity; Private HC company 1848 • Private insurance(“the Blues”) becomes prevalent in the 1930’s and 40’s • Need to attract workers during WWII led to employee sponsored plans and they became tax deductible if employee sponsors • Efforts at a universal insurance have been defeated on numerous occasions
Healthcare systems: inputs and outputs Our comparison between systems will focus first on Outputs
Life Expectancy and Wealth are Correlated http://www.gapminder.org/world/#$majorMode=chart$is;shi=t;ly=2003;lb=f;il=t;fs=11;al=30;stl=t;st=t;nsl=t;se=t$wst;tts=C$ts;sp=5.59290322580644;ti=2013$zpv;v=0$inc_x;mmid=XCOORDS;iid=phAwcNAVuyj1jiMAkmq1iMg;by=ind$inc_y;mmid=YCOORDS;iid=phAwcNAVuyj2tPLxKvvnNPA;by=ind$inc_s;uniValue=8.21;iid=phAwcNAVuyj0XOoBL_n5tAQ;by=ind$inc_c;uniValue=255;gid=CATID0;by=grp$map_x;scale=log;dataMin=194;dataMax=96846$map_y;scale=lin;dataMin=23;dataMax=86$map_s;sma=49;smi=2.65$cd;bd=0$inds=;example=75 As a general rule, Health, measured by life expectancy, increases with greater wealth
Health spending (excluding investment) Public expenditure Private expenditure 15.0 10.0 5.0 0.0 1Preliminary estimate. 2Data refer to 2012. Health spending (excluding investment) as a share of GDP, OECD countries, 2013 US spends 35 to 50% more than peer countries on healthcare; this amounts to $750B in overspending (PPP) in 2013
OECD HC spending Since 1980 • HC Spending in the USA skyrockets from 1980 on
Healthcare spending growth is slowing worldwide US HC spending growth slows along with most Developed Countries
Out of Pocket Per Capita HC Spending US Residents spend more than 5 times what the next highest country spends for insurance and other out of pocket spending OECD 2015, PPP $ *Includes insurance and durables (wheel chairs, etc.)
Global (OECD) HC Spending by Components Outpatient and long term care remain fastest growth components
Public Spending and Public Coverage WHO, 2014 US public spending covers a smaller population in percentage terms and costs more
Healthcare Cost Takeaways • USA HC System is up to 50% more expensive than peer countries as a % of GDP • For estimated $2.8 trillion spent in 2013, we overspent $750 billion on PPP basis • The spending gap between USA and other countries has widen since 1980 • Out of Pocket costs in the USA are multiple times higher than in other developed countries on PPP basis • Healthcare spending growth since 2009 seems to be slowing USA – High Cost Country for HC
Commonwealth Fund Survey on Sicker Adults • Sicker adults randomly chosen among those who • Claimed fair or poor health • Had a serious illness, chronic illness, major surgery or major hospitalization in last 2 years • Participants in the survey • 700 to 750 in New Zealand, Australia and Canada • Over 1500 in US, UK and Germany • 2005-6 survey
Access to care: Wait time to see a Doctor % patients answering “yes” Commonwealth Fund Survey, 2006 USA wait times to see a Doctor for sicker adults mixed when compared with peer countries
Wait times for Elective or non emergency surgery % patients answering “yes” Commonwealth Fund Survey, 2006 USA wait times for elective surgery relatively short vs peer countries
Coordination Problems with one or more Doctors % patients answering “yes” Commonwealth Fund Survey, 2006 USA has more issues with coordination With care among 4 or more doctors
Doctors and Patients Regular Doctor providing easy to understand explanations Regular Doctor giving enough time to ask questions and raise concerns Commonwealth Fund Survey, 2010 USAin lower half of OECD countries surveyed on Doctor / patient relations
Most OECD countries have achieved 100% coverage OECD 2013, except for US numbers are for 2014 USA, Mexico and Estonia remain laggards in coverage numbers despite first year of Obamacare ( ACA)
Percent 80 70.0 Private 60 40 Uninsured 20 18.6 12.9 Public 0 1997 2000 2003 2006 2009 2012 2015 (Jan–Sep) Healthcare Insurance in the USA 28.8 million persons of all ages (9.1%) were uninsured at the time of interview in 2015 —7.2 million fewer than in 2014 and 16.0 million fewer than in 2013. NOTE: Data are based on household interviews of a sample of the civilian noninstitutionalized population. SOURCE: CDC/NCHS, National Health Interview Survey, 1997–2015, Family Core component.
Type Healthcare Insurance Coverage in USA, 2014 All Americans Of those insured Private HC Insurance covers around 50% of all Americans CDC National Healthcare Survey, 2014 (some respondents had two sources insurance)
Limited Access due to out of Pocket Cost 51% of patients w/ limited access USA patients’ access most affected by out of pocket costs % patients answering “yes” Commonwealth Fund Survey, 2006
Amenable Mortality Rate in OECD Countries Age standardized rate per 100,000 population in 2007, or last year available OECD Health Working Papers, 2011 USA has a high rate in “treatable” deaths (death avoidable if proper healthcare was available)
Healthcare Service/Access Takeaways • USA, despite excellent numbers for elective surgery wait times, is in the middle of the pack or lagging in some key service measures • Healthcare Insurance coverage remains low in the USA with the USA having one of the highest rates of private coverage • This low and uneven coverage seems to result in out of pocket costs limiting people’s access to care • Among OECD countries, the USA ranks high in avoidable deaths due to lack of care USA has mixed performance on service and very low performance on access, resulting in higher avoidable deaths
Broad Measures of USA Health not Encouraging Commonwealth Fund Survey, 2006 Comparatively, USA: low life expectancy, …and high infant mortality rates
USA: Life Expectancy by Race and Sex Life expectancy at birth, by race and sex: United States, 2010 SOURCE: CDC/NCHS, National Vital Statistics System, Mortality. Difference in life expectancy is significant by race and sex but..
Is dwarfed by Differences in life expectancy by income level Affluent men and women show big increase in life expectancy, low wage populations stagnant
Infections and Readmissions Infections While in Hospital % patients answering “yes” Readmitted or ER due to complications Commonwealth Fund Survey, 2006 USA in the middle of the pack for Infections and Readmissions
Medical or Test Error in last 2 years Patients reporting errors with last 2 years % patients answering “yes” Of these errors % occurring outside the Hospital Commonwealth Fund Survey, 2006 Late or mislabeled test results, doctor files most cited as issues
Chronic Care (high is good) Quality of Diabetes and Hypertension care Middle of the Road In USA
Chronic Care (high is bad) Quality of Chronic care is Mediocre in USA
Lower Extremity Amputations as a Result of Diabetes, 2011 Amputations per 100,000 population * Data from 2010 for the Netherlands, Switzerland, and the U.S.; and 2009 for Denmark. Source: OECD Health Data 2015.
5 year survival rates for Cancer USA near the top for Breast, Prostate and Colorectum survival rates
Mortality as a Result of Cancer, 1995 to 2007 Deaths per 100,000 population (adjusted)* * Mortality rates are adjusted for likelihood of death from other causes. Source:W. Stevens et al., “Cancer Mortality Reductions Were Greatest Among Countries Where Cancer Care Spending Rose the Most, 1995–2007,” Health Affairs, April 2015 34(4):562–70.
Mortality as a Result of Ischemic Heart Disease, 1995 to 2013 Deaths per 100,000 population * Data from 2012 for Denmark and Switzerland; 2011 for France, Canada, Australia, and New Zealand; and 2010 for the U.S. Source: OECD Health Data 2015.
Healthcare Quality/Outcomes Takeaways • From the broad measures of HC systems US performance is mediocre to underperforming (Life expectancy and Infant mortality) • More precise measures of outcomes and quality are mixed (and difficult to assess) with some islands of excellence in outcomes (Cancer, breast cancer, etc.) USA has very mixed performance in comparison with other developed countries
Comparing Healthcare Systems VALUE? • Are we getting the value from the additional money we spend on Healthcare?
Strengths of US HC System • Innovation and rapid adoption of new technology, new drugs and new processes • Premium Healthcare institutions: top hospitals (John Hopkins, Mayo clinic, academic medical centers, etc. ), medical tourism – people seek out care in USA • Cancer survival rates higher: 5 year rate in US at 66% vs 47% for rest of OECD • Shorter waiting times for visits and elective surgery
Mixed performance of US HC System • Rapid adoption of new technology, new drugs and new processes can lead to safety issues and questions of efficacy • Despite large amount of insurance plans, patients have limited choice of plans: 50% of Americans have a choice of 3 plans or less; Other countries ( Denmark, Portugal) offer as much choice (before Obamacare)
Weaknesses of US HC System • US lags in key population level measures: infant mortality and amenable mortality rates • Service and quality measures show the USA system in the middle of the pack among peer countries with some lagging measures • Access to care – 12% without insurance and a larger percentage with partial insurance leads to negative health outcomes One additional Question: Is the US population sicker than other populations?
Cardio Risk Analysis for top Income Countries Risk for cardiac event in 5 years for males aged 50-54 per 1000, OECD, 2009 USA Risk profile for Cardiac event: higher for higher risk, lower for moderate and low risk individuals than top income countries
Disease Spending and Prevalence US expenditures by disease condition Disease prevalence: US vs peer countries Higher US prevalence $ billions McKinsey, 2006 US population is slightly less sick than peers (lower prevalence) due to: lower smoking rates and younger population. Obesity is higher in USA