Download
1 / 28
290 likes | 753 Vues
Learn about the difference between descriptive and inferential statistics, along with key terms, methods, and practical examples. Explore measures like mean, median, mode, variance, and more. Understand how statistics can aid decision-making and analysis in various fields.

E N D
Descriptive & Inferential Statistics Adopted from ;Merryellen Towey Schulz, Ph.D. College of Saint Mary EDU 496
Collections of numerical data Summary measures calculated from a collection of data Activity of using and interpreting a collection of numerical data Last year’s enrollment figures Average enrollment per month last year Evaluators made a projection of next year’s enrollments The Meaning of Statistics Several Meanings
Descriptive Statistics • Use of numerical information to summarize, simplify, and present data. • Organized and summarized for clear presentation • For ease of communications • Data may come from studies of populations or samples
Descriptive Stats Vocabulary • Central tendency • Mode • Median • Mean • Variation • Range • Standard deviation • Normal distribution
Descriptive Stats Vocabulary cont’d • Standard score • Effect size • Correlation • Regression
Inferential Statistics • To generalize or predict how a large group will behave based upon information taken from a part of the group is called and INFERENCE • Techniques which tell us how much confidence we can have when we GENERALIZE from a sample to a population
Inferential Stats Vocabulary • Hypothesis • Null hypothesis • Alternative hypothesis • ANOVA • Level of significance • Type I error • Type II error
Descriptive Statistics Graphical Arrange data in tables Bar graphs and pie charts Numerical Percentages Averages Range Relationships Correlation coefficient Regression analysis Inferential Statistics Confidence interval Margin of error Compare means of two samples Pre/post scores t Test Compare means from three samples Pre/post and follow-up ANOVA = analysis of variance Examples of Descriptive and Inferential Statistics
Problems With Samples • Sampling Error • Inherent variation between sample and population • Source is “chance or luck” • Results in bias • Sample statistic -- a number or figure • Single measure -- how sure accurate • Comparing measures --see differences • How much due to chance? • How much due to intervention?
What Is Meant By A Meaningful Statistic (Significant)? • Statistics, descriptive or inferential are NOT a substitute for good judgment • Decide what level or value of a statistic is meaningful • State judgment before gathering and analyzing data • Examples: • Score on performance test of 80% is passing • Pre/post rules instruction reduces incidents by 50%
Interpretation of Meaning • Population Measure (statistic) • There is no sampling error • The number you have is “real” • Judge against pre-set standard • Inferential Measure (statistic) • Tells you how sure (confident) you can be the number you have is real • Judge against pre-set standard and state how certain the measure is
Statistics has two major chapters: • Descriptive Statistics • Inferential statistics
Descriptive Statistics Gives numerical and graphic procedures to summarize a collection of data in a clear and understandable way Inferential Statistics Provides procedures to draw inferences about a population from a sample Statistics
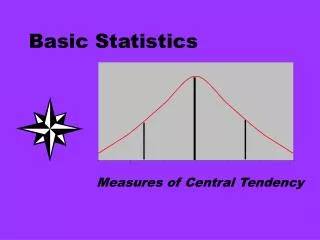
Descriptive Measures • Central Tendency measures. They are computed to give a “center” around which the measurements in the data are distributed. • Variation or Variability measures. They describe “data spread” or how far away the measurements are from the center. • Relative Standing measures. They describe the relative position of specific measurements in the data.
Measures of Central Tendency • Mean: Sum of all measurements divided by the number of measurements. • Median: A number such that at most half of the measurements are below it and at most half of the measurements are above it. • Mode: The most frequent measurement in the data.
MEAN = 40/10 = 4 Notice that the sum of the “deviations” is 0. Notice that every single observation intervenes in the computation of the mean. Example of Mean
Median: (4+5)/2 = 4.5 Notice that only the two central values are used in the computation. The median is not sensible to extreme values Example of Median
In this case the data have tow modes: 5 and 7 Both measurements are repeated twice Example of Mode
Mode: 3 Notice that it is possible for a data not to have any mode. Example of Mode
Variance (for a sample) • Steps: • Compute each deviation • Square each deviation • Sum all the squares • Divide by the data size (sample size) minus one: n-1
Variance = 54/9 = 6 It is a measure of “spread”. Notice that the larger the deviations (positive or negative) the larger the variance Example of Variance
The standard deviation • It is defines as the square root of the variance • In the previous example • Variance = 6 • Standard deviation = Square root of the variance = Square root of 6 = 2.45
Percentiles • The p-the percentile is a number such that at most p% of the measurements are below it and at most 100 – p percent of the data are above it. • Example, if in a certain data the 85th percentile is 340 means that 15% of the measurements in the data are above 340. It also means that 85% of the measurements are below 340 • Notice that the median is the 50th percentile
For any data • At least 75% of the measurements differ from the mean less than twice the standard deviation. • At least 89% of the measurements differ from the mean less than three times the standard deviation. Note: This is a general property and it is called Tchebichev’s Rule: At least 1-1/k2 of the observation falls within k standard deviations from the mean. It is true for every dataset.
Suppose that for a certain data is : Mean = 20 Standard deviation =3 Then: A least 75% of the measurements are between 14 and 26 At least 89% of the measurements are between 11 and 29 Example of Tchebichev’s Rule
Further Notes • When the Mean is greater than the Median the data distribution is skewed to the Right. • When the Median is greater than the Mean the data distribution is skewed to the Left. • When Mean and Median are very close to each other the data distribution is approximately symmetric.