Download
1 / 22
220 likes | 541 Vues
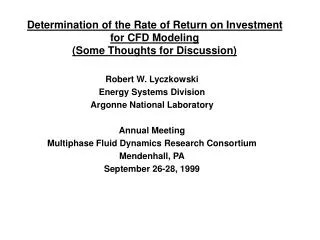
Determination of the Rate of Return on Investment for CFD Modeling (Some Thoughts for Discussion). Robert W. Lyczkowski Energy Systems Division Argonne National Laboratory Annual Meeting Multiphase Fluid Dynamics Research Consortium Mendenhall, PA September 26-28, 1999 .

E N D
Determination of the Rate of Return on Investment for CFD Modeling(Some Thoughts for Discussion) Robert W. Lyczkowski Energy Systems Division Argonne National Laboratory Annual Meeting Multiphase Fluid Dynamics Research Consortium Mendenhall, PA September 26-28, 1999
Global Considerations • Chemical plants handling liquids and gases have an average efficiency of 84 % (Merrow, 1985) • Producers handling solids experience a 63% efficiency (Ibid) • Experimental and testing work in the area of solids handling would have a high payoff (Ibid) • Each month a solids-processing plant slips behind schedule is conservatively estimated to add $350k to the capital cost (Merrow, 1988) • With improved understanding of granular solids behavior it is reasonable to expect an increase in reliability to 68 % with savings of $730 million/yr for new coal-fired power plants alone (Plasynski et al., 1992)
Global Considerations Cont’d) • A minimum of 40 % of U. S. chemicals companies are involved with solids handling and produce more than $61billion/yr. (Ennis et al., 1994) • If CFD modeling could narrow the gap between 84 and 63 % efficiencies by 1 %, a $200 million savings would result • QUESTION: HOW MUCH EFFORT TO EXPEND TO EFFECT THIS SAVINGS??
Quantitative Components of CFD ROI • reduced time to finalize a design change to mitigate a specific problem • reduction in the number of laboratory experiments to test the design change • reduced time to scale up by reducing the number of pilot plant stages • elimination of large scale experimental facilities • decreased plant down-times • increased throughput,
Quantitative Components of CFD ROI (Cont’d) • process optimization for improved energy efficiency • reduction in pollutant formation • streamlining the supply chain
Qualitative Components of CFD ROI • Better understanding of process behavior • increased confidence • increased ability to innovate • increased product quality • increased safety
Return On Investment Template CASE STUDY No. 1 COMPANY: Precision Combustion, Inc. PROJECT: Gas Turbine Combustor Optimization SOURCE: FLUENT NEWS Vol. 7, Issue 2 (1998) COST BASIS: Staff: $200k/yr (fully burdend) CFD License $20k/yr (medium size company) Startup cost $100k amortized over 4 years ($25k/yr) Equipment $10k workstation amortized over 2 years ($5k/yr assuming zero salvage value) M&S $15 k/yr (includes secretarial, report preparation, travel)
Return On Investment Template (Cont’d) SIMULATION EFFORT 1 month SIMULATION COST Staff $16.67k Equipment 0.4k Startup cost 2.1k License 1.67k M&S 1.26k TOTAL $22.1k COST SAVINGS $200k (Fluent News, Vol. 7, Issue 2 (1998) TYPE OF SAVINGS Elimination of Testing CFD ROI $200k/$22.1k = 9.05
The Following slides are supplied through the courtesy of Nurez Mapera of AEA Technology Engineering Software, Inc.
Batch Processing Business Drivers To increase profitability, of course, but how... • Generate a larger number of new products and introduce them more quickly and efficiently than the competition, and • Reduce manufacturing costs and increase efficiency for existing products (to a varying lesser degree).
Batch Processing Margin Squeeze Reference: “The Development Factory”, Gary Pisano Historical Revenues Profits and Costs Margins Historical Fixed Development and Manufacturing Costs Years from Product Launch
Batch Processing Margin Squeeze Reference: “The Development Factory”, Gary Pisano Historical Revenues Profits and Costs Margins New Fixed Development and Manufacturing Costs Historical Fixed Development and Manufacturing Costs Years from Product Launch
Batch Processing Margin Squeeze Reference: “The Development Factory”, Gary Pisano Historical Revenues Revenues with Increased Price Pressures and Shorter Cycles Profits and Costs Margins New Fixed Development and Manufacturing Costs Historical Fixed Development and Manufacturing Costs Years from Product Launch
Potential impact on: Time to Market Costs PROFIT The Earlier the Better Potential Savings ($) Process Chemistry Pilot Plant Production
The Earlier the Better: Benefits • Conceptual design • < 5% of project man-hours ~ > 80% of cost • “Get it right first time” culture • Dependence on contractors & vendors • “Black art” vs. scientific approach • Confidence level, quality and quantity of available information Potential Savings ($) Process Chemistry Pilot Plant Production
POPI Lifecycle Model Reference: “Program on the Pharmaceutical Industry”, MIT • Peak revenues of $550 million/year • Revenues reduced to $225 million after patent expiration (7 years after product introduction) • Cost of goods sold = 21% of revenue What if . . ? • Reduce time to market by 4 months ~ Improved co-ordination across R&D and manufacturing(Save ~US1MM/day) • Reduce cost of goods sold by 30% over 3 years ~ Improved manufacturing practices (reduced costs, increased yield, etc.)
Time-to-Market Effect Cost Reduction Effect Reference: “Program on the Pharmaceutical Industry”, MIT 350 Profits ($ Millions) Typical Profit Cycle 75 0 -200 1.00 8.25 15.50 22.75 30.00 Years
The Opportunity $800 million increased profit over 30 years
Typical Batch Processing Tools Chemical Process R&D Pilot Plant Production Discovery SAP MS-WORD MS-EXCEL Heat Transfer ISIS BatchCAD EpSelon Wastewater ChemDraw Emission Master Crystallization - Decision Support Azeotrope / Solvent Recovery Tools OpenBatch Wonderware CFD Filtration/Drying - Decision Support Control & Instrumentation Software VISIO