Seasonal and Monthly Profiles of CN and Temperature Above Laramie and McMurdo Stations
40 likes | 194 Vues
This study presents averaged cloud condensation nuclei (CN) and temperature profiles from Laramie, Wyoming (41°N) over 1982-2012, and McMurdo Station, Antarctica (78°S) from 1986-2010. Data are seasonally averaged for Laramie and monthly averaged for McMurdo, highlighting variations in CN concentration and temperature. The uncertainty in CN measurements is detailed at 10% to +35%, alongside a ±0.5°C uncertainty for temperature. The study compares model runs of hydrated formulations to observational data, improving understanding of atmospheric conditions in polar and midlatitude regions.

Seasonal and Monthly Profiles of CN and Temperature Above Laramie and McMurdo Stations
E N D
Presentation Transcript
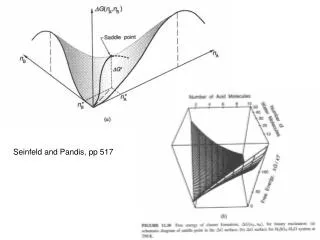
Hydrates n1-n4
Figure 1. Averaged CN (r>0.003–0.01 μm) and temperature profiles observed (a, b) above Laramie, Wyoming (41°N) for 1982–2012 and (c, d) above McMurdo Station, Antarctica (78°S) for 1986–2010. The data are seasonally averaged for Laramie and monthly averaged for McMurdo according to the legends in Figures 1a and 1c. The shaded areas indicate the 10 to + 35% uncertainty in the CN measurement, as discussed in the text, as well as a ± 0.5°C uncertainty for the temperature measurements. Campbell and Deshler, JGR, 2014
Figure 7. (a) Ambient temperature (black solid), H2O mixing ratio (purple solid), and midlatitude (brown solid) and derived polar H2SO4 vapor density (brown dashed) profiles used for themodels. A balloon-borne hygrometer H2O mixing ratio measurement (purple dotted) is also shown for comparison in Figure 7a. (b) CBHN model runs based on two hydrated model formulations (red: J-V-M; blue: Noppel), compared to the CN observation (r>0.003–0.01 μm) at McMurdo on 940817 (plus symbols). In Figure 7b, the solid and dashed lines represent the CBHN calculations using the midlatitude and derived polar H2SO4 vapor density profiles, respectively. Campbell and Deshler, JGR, 2014