Math Challenges: Algebra Problems Explained
Dive into algebra problems with real-world scenarios and mathematical concepts explained thoroughly. Discover patterns, solve equations, and explore geometry challenges with these educational projects.

Math Challenges: Algebra Problems Explained
E N D
Presentation Transcript
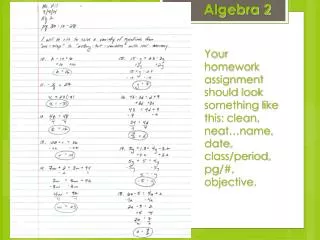
Algebra 1 - POW Project Granny While driving down a foggy highway in her brand new S.U.V., Grandma Mary was worried about how far she could see ahead. On the radio, the newscaster stated, “Visibility is down to 350 feet.” Suddenly Grandma could see the flashing lights of a stalled vehicle; she slammed on the brakes and her S.U.V. screeched towards the helpless car. Before she knew it, Grandma’s front end was smashed up against the smaller vehicle. Fortunately, no one was in the car, and Grandma came away with only scrapes and bruises. However, when the State Troopers came to the scene, a husky officer came over to Grandma Mary and told her, “ I am going to have to give you a speeding ticket, by the looks of things, you were going beyond the speed limit of 65 miles per hour.” Grandma responded with, “You are out of your mind Sonny, I always drive safely. Anyways, you weren’t even here.” With a confident look, the officer stated, “I didn’t need to be here, I am good at math, I measured the distance of your skid to figure it out. Here is you ticket.” “You will be hearing from my lawyer, and my math teacher,” Grandma shouted as the officer got in his car. Is Grandma correct? Or is the officer correct? Use the table below to answer that question. Thoroughly explain and validate your answer by using all the necessary and appropriate math.
Algebra 2 POW – The Birthday Cake Determining the maximum /minimum number of pieces in which it is possible to divide a circle (birthday cake) for a given number of cuts is called the circle cutting or pancake cutting problem. Use the table below to help organize your work to come up with your answers.
Algebra 2 POW – The Birthday Cake Extra Serving: The problem of dividing a circle by lines can also be generalized to dividing a plane by circles. As can be seen above, the maximal numbers of regions obtained from n = 1, 2, 3, circles are given by 2, 4, 8. What is the maximum number of regions a plane can be divided by 4 circles. Show the drawing and explain the numerical pattern.
Project: Follow Me Consecutive Numbers Which natural numbers can be expressed as the sum of two or more consecutive natural numbers? Use your calculator and your equation solving skills to find the solutions.
Project: Follow Me Consecutive Numbers – Page 2 Describe in a complete sentences three patterns that you found after finishing the table. 1. 2. 3. Which numbers cannot be written as a consecutive sum? What is special about these numbers? Write 95 as the sum of 5 consecutive natural numbers. Write 64 as the sum of 4 consecutive numbers. In algebra, the sum of any two consecutive numbers is x + (x+1)= 2x +1. Complete the table below to express the sum of different lengths of consecutive numbers.
Follow Me- Homework Consecutive Integers Word Problems Solve each problem below by a guess and check method and then by writing and solving an equation. Show your work in the table
GEOMETRY POW #1 – The Checkerboard How many squares are there on an 8x8 checkerboard? And the answer is not 64. Oh yeah, the answers is not 65 either.
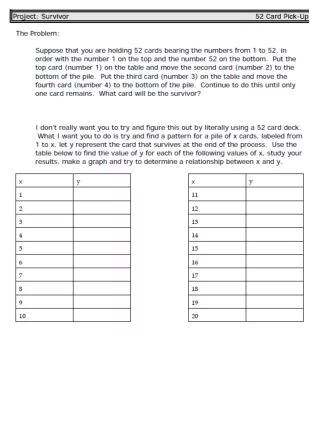
Mathematical Survivor Project: Last One Standing The cast of “Mathematical Survivor” is a collection of n not necessarily distinct real numbers {x1,x2,x3,…,xn}, where n>1. From this collection, we select any two numbers, say xa and xb, delete these from the collection, and insert the number xaxb+xa+xb into the collection. The process to find the mathematical survivor includes continuing the selection of two random numbers from the new collection and performing the deletion and insertion process. Proceed until the collection has a single number left. This number is the survivor. Part 1 Find the survivor for the set of numbers {2, 4, 6, 8}. You can randomly choose the two numbers to start with. Once you find the survivor, repeat the process two more times to find the surviving number. Make sure to alter your choice of numbers to delete. EXTRA:How many different ways can a survivor be produced when starting with 4 numbers in your collection. You know there has to be at least 3 different ways since you completed part 1. Part 2 Using you inductive reasoning skills, make a conclusion about the survivor from the set of numbers {2, 4, 6, 8}. Choose your own set of 4 numbers and find the survivor. Find the survivor two more times for your set. What conclusions can you make now? Part 3 The next obvious question is whether or not a mathematical survivor of a collection of numbers is predictable at the outset and is it totally independent of the selection process made throughout the process. The answer to the question is YES. The theorem below explains the results. If S = {x1, x2,…, xn} is a collection of n not necessarily distinct real numbers, where n>2,then the mathematical survivor of S is guaranteed to be (x1+1)(x2+1)…(xn+1)-1 Use the theorem to verify that you found the correct survivor for the sets in Part1 and Part 2. Part 4 Use the theorem above to find the survivors for the following sets. Use the results from above to find the survivor for {c,c,…,c} (n copies), where c is some number . EXTRA, EXTRA Find the mathematical survivor for the following set: Marty Romero, Wallis Annenberg High School, Adapted from Math Horizons Magazine, February 2007
What Goes Around Comes Around Project: Hailstone Numbers A particularly famous problem in number theory, the hailstone problem, has fascinated mathematicians for several decades. It has been studied primarily because it is so simple to state yet apparently intractably hard to solve. This problem is also known as the 3n+1 problem, the Collatz algorithm, and the Syracuse problem. If the number is even, divide by 2, if it is odd, multiply by 3 and add 1. Answer the following questions What is the pattern for the number of steps for 2, 4, 8, and 16? Predict how many steps the number 32 will have? How many steps for 128? 1. What is the pattern for any of the numbers that are doubles of each other? For example, 5 and 10, 7 and 14? 2. Predict how many steps are needed for the numbers 40, 80 and 100. How many steps does it take 76 to get to 1? 3. Fill in the missing numbers from the number chain. There are two answers. _____, 15, 46, 23, … _____, 15, 46, 23, … 4. 5. Of the first 1,000 integers more than 350 have their maximum at 9,232. Find one of the integers that has a maximum of 9232.
What Goes Around Comes Around Project: Hailstone Numbers Hailstone Numbers By Ivars Peterson Muse, February 2003, p. 17. Nothing could be grayer, more predictable, or less surprising than the endless sequence of whole numbers. Right? That's why people count to calm down and count to put themselves to sleep. Whole numbers define booooooooring. Not so fast. Many mathematicians like playing with numbers, and sometimes they discover weird patterns that are hard to explain. Here's a mysterious one you can try on your calculator. Pick any whole number. If it's odd, multiply the number by 3, then add 1. If it's even, divide it by 2. Now, apply the same rules to the answer that you just obtained. Do this over and over again, applying the rules to each new answer. For example, suppose you start with 5. The number 5 is odd, so you multiply it by 3 to get 15, and add 1 to get 16. Because 16 is even, you divide it by 2 to get 8. Then you get 4, then 2, then 1, and so on. The final three numbers keep repeating. Try it with another number. If you start with 11, you would get 34, 17, 52, 26, 13, 40, 20, 10, 5, 16, 8, 4, 2, 1, and so on. You eventually end up at the same set of repeating numbers: 4, 2, 1. Amazing! The numbers generated by these rules are sometimes called "hailstone numbers" because their values go up and down wildly—as if, like growing hailstones, they were being tossed around in stormy air—before crashing to the ground as the repeating string 4, 2, 1.Mathematicians have tried every whole number up to at least a billion times a billion, and it works every time. Sometimes it takes only a few steps to reach 4, 2, 1; sometimes it takes a huge number of steps to get there. But you get there every time. Does that mean it would work for any whole number you can think of—no matter how big? No one knows for sure. Just because it works for every number we've tried doesn't guarantee that it would work for all numbers. In fact, mathematicians have spent weeks and weeks trying to prove that there are no exceptions, but they haven't succeeded yet. Why this number pattern keeps popping up remains a mystery.
“Looking Out for No. 1” Project: Benford’s Law In the late 19th century, Simon Newcombe, an astronomer and mathematician, noticed that the pages of heavily used books of logarithms, were more worn at the beginning than the end. This suggested that scientists tended to look up smaller numbers more often than larger ones. In 1938 Dr. Frank Benford, physicist for General Electric, noticed the same phenomenon that Newcombe observed earlier. Dr. Benford went on to conclude that it was unlikely that physicists and engineers had some preference for logarithms starting with one. He embarked on a numerical investigation that analyzed over 20,000 numbers that he got from collections as obscure as the drainage areas of rivers, stock market figures, baseball statistics, and atomic weights. He discovered that 30% of the observed numbers began with the digit 1. Benford’s Law goes on to state that that the probablity of a given first digit D is: Experiment 1. Your first job is to complete a table of values for Benford’s formula. Once your table is complete, make a scatter plot of the data. It should look similar to the one above. 2. Using the randInt() command on your calculator, multiply two randomly large numbers together and record the first digit of the result. Use the following command, randInt(1000,9999)*randInt(1000,9999), to obtain your results. Make at least one hundred calculations. 3. Once you have completed your tabulations, calculate the percentages for each of the digits. Make a scatter plot for your collected data. Draw the function for Benford’s Law with your data. How close does it come to satisfying formula? 4. It is your task now to find some data to analyze with respect to Benford’s Law. Use the internet to help give you ideas as to what sets of data to use. No student is allowed to use the same set of data. Once you have chosen your set, make a complete analysis of the frequency and percentage of the first digit of the numbers. Test to see if you data is valid for Benford’s Law. 5. Last but not least, write a one page research summary for Benford’s Law. Make sure to include how the law gets applied in the real world. Also, give an example of a set of data that does not pertain to Benford’s Law. Explain why this set does not work. References: http://students.bath.ac.uk/ma2decr/Applications.html http://www.abc.net.au/science/k2/moments/s116315.htm http://www.math.yorku.ca/Who/Faculty/Brettler/bc_98/benford.html Marty Romero, Los Angeles Wilson High School
Wilson High School Activity Card Wilson High School wants to boost interest in sports and school activities. It has decided to sell an activity card that will allow the holder to enter all sporting events free as well as get discounts on other school activities. The entire student body was surveyed and asked the question, “What is the most you would pay for an activity card?” The results of the survey are given below. Use the data to determine the optimal ticket price.
Policy Brief #14 - Dropouts Project: We Will Make It Addressing California’s high school dropout crisis requires understanding the academic lives of students. Although the causes of dropping out are many and complex, students’ school experiences certainly play a critical role. Because the trajectories leading students either to high school graduation or to dropping out begin years before these events, identifying relevant school-related factors requires a comprehensive analysis of longitudinal district-, school-, and student-level data. In this project you will get a chance to use mathematics to analyze the things that can predict if a student is not going to make it through high school. Hopefully, with your analysis, you will be able to think deeply about what it will take for all of you to make it. GRADUATION RATES BY COURSES FAILED Preschool 1. Read Policy Brief #14 from the California Dropout Research Project - Make a list of the things you now know after reading the brief and make a list of things you now wonder about. 2. After hearing each group's presentations, including your own, write a thoughtful response to one of the things someone is wondering about? Respond to the best of your ability, there are no right or wrong answers. Percent Graduating HIGH SCHOOL MIDDLE SCHOOL Courses Failed 3. Share your response from above with your group - then describe an "aha" moment you had while listening to others present. 4. What do you think are some things that prevent students from finishing high school? What do you think are some things that help students graduate high school? Elementary School 5. Explain what it means for something to be 50/50. What does it mean in the context of this policy brief? 6. Based on the research described in the policy brief, approximately how many the original students in the study graduated on time? Show the math you used to calculate your answer. 7. Based on the fail-rate statistic stated in the policy brief, how many students in your school are expected to fail Algebra 1? You will need to ask someone other than your teacher (ME) how many students are taking Algebra 1 in the school. Show your work. 8. Based on the policy report, the chances of an English Language Learner (ELL) in our school of graduating is one and three. What does that mean, and how many of our 9th grade ELL's will graduate? Middle School 9. The graph below represents the percentage of students who graduate when considering the number of courses these students fail in middle school and high school. Make some conclusions about what the graph tells us. 10. Now that you are in high school, you can predict the chances you will graduate high school by recounting how many classes you failed in middle school. How many classes did you fail? Use the graph to help you determine your chances of graduating. Do you agree or disagree with this result? Why? 11. Now use the graph to estimate the actual values by "eyeing" the data - make a good guess at each of the values and record them in a table that looks like the provided. Check with a peer to verify that you are getting similar values- Make sure to make your table on a separate sheet.
Policy Brief #14 - Dropouts Project: We Will Make It 12. Once you have the data in the table, hand plot the points on a correctly labeled coordinate plane. 13. Using any method described in class, find a line of best fit for the high school data. Depending on which points you choose to use, you might have a different result form others in the class. Check with others and record a different equation than yours. 14. If your best friend who is in 12th grade has failed 4 classes, what do the equations predict as their chances of graduating? Show your work. 15. How many classes would a student have to fail for them to have a 0% chance of graduating? Use your equations to calculate these values. 16. In a real-world context, explain what the value of the slope means - explain how this is related to the policy brief. What does the value of the y-intercept mean? High School Write a summary explaining what you learned in this project and how it will or will not change the way you plan out your academic future. Also, include a discussion about other things (factors) that happen in a student’s school or personal life that can predict whether or not a student will graduate high school. There is no wrong or right answer, I just want you to think critically and discuss with others these issues. College (Extra Credit) The middle school graph represents another more advanced function that you will study in Algebra 2, but we can introduce it to you now. Instead of finding a line of best fit, you would have to find the exponential function of best fit because the graph of the middle school data is curved.. The equation that represents the middle school data is y=69(0.82)x. Complete the table of values by using your equation, then plot the values on the graph to see how they match your estimates. Lastly, research exponential functions and explain the meaning of the numbers in the equation y=69(0.82)x .
Could You Live Forever? Project: Life Expectancy When it comes to long life, Jeanne Calment is the world’s record holder. She was born before Edison invented the light bulb and lived to the ripe age old age of 122. When asked the secret of her longevity, Calment guessed that God must have forgotten about her. In this project, we will investigate the life expectancy of humans and maybe answer the question, could we actually live forever? PART I 1. The table from the right comes from The Muse magazine, February 2004. Using your calculator or on graph paper, carefully graph each of the sets on the same axes. After some analysis, it is obvious that the data is linear in nature. Using your method of choice, find a line of best fit for the data. What is the physical interpretation of your slope and y-intercept? Explain why these values make sense. 2. Using your equations from above, how many days remaining does a 50 year old male and female have to live? How many years is that? 3. 4. Using the equations once again, find out at what age does a male and female have zero days of life remaining. What is the interpretation of your answer? Explain why there is a difference between men and women? PART II The data above on life expectancies for all Americans comes from the Center for Disease and Control. Make a careful graph of the data, you may want to use ’50’ for 1950 and so on. Aside from the value in 1970, you should see that most of our points line on a line. Any possible explanation for this one point? 5. 6. Using your preferred method, find a line of best fit for the data. Then using your equation, what is the projected life expectancy in the year 2050 and 2100? 7. Although the projections of life expectancy is not a sure science, two scientist Steve Austad and Jay Olshansky placed a bet on whether anyone alive in the year 2000 will be still around in the year 2150. In other words, will someone alive today live to be 150? Use your equation to help determine whether or not it seems possible for someone to live to 150 by the year 2150. Explain your reasoning. EXTRA CREDIT Both guys drew up a contract and each put $150 in a bank account. The winner’s heirs will get the cash. With interest over 150 years, how much money could that be?
Does Race Matter? Projected Life Expectancy http://abcnews.go.com/WN/us-hispanics-longer-life-expectancy-white-black-americans/story?id=11883156#.Tw6IAlZki7s • What do you know? / What do you Wonder? • Make a list of the things you now know from analyzing the table of values and make a list of things you now wonder about. • After hearing each group's presentations, including your own, write a thoughtful response to one of the things someone is wondering about? Respond to the best of your ability, there are no right or wrong answers. • Data Analysis • Using a clean sheet of graph paper, make a scatter plot of the data for the white, black, asian, and hispanic groups. The year (2010=10) should be the dependent variable and the projected life expectancy should be the independent variable. Does the graph confirm what you know? • Using the graphical representation along with the members of the group to decide, which function best represents the data? Find equations that best represents that data. • What are the equations? • Extrapolation • Just by looking at the equations you found in part 5, what were the life expectancies for each of the races in the year 2000? Which group has the highest life expectancy in the year 2000? Does this surprise you? Why or why not? • Use your equations to predict when the life expectancy for each of the races will be 100 years. which group will live to 100 first? Is it the same answer as part 6? What values in your equations help you understand what your answer in part 7 is not that same as part 6? Explain your answer? • Use your algebra skills to find the year that whites and hispanics have equivalent life expectancies. Do the same whites and blacks, hispanics and asians, and hispanics and blacks. • Analysis • In the article Why do Hispanics outlive Whites and Black Americans, the reporters are surprised by these findings. Why do you think they were surprised? Why do you think Hispanics outlive the other groups? • Read the article to see if some of your answers in part 9. are similar to the scientists trying to explain the results. What do you think about their findings?
Mathematical Modeling Project: The Need for Speed Fuel economy at steady speeds with selected vehicles were studied in 1973, 1984, and 1997. The most recent study indicates greater fuel efficiency at higher speeds than earlier studies; for example, some vehicles achieve better mileage at 65 than at 45-mph, although not their best economy, such as the 1994 Oldsmobile Cutlass, which has its best economy at 55 mph (29.1 mpg), and gets 2 mpg better economy at 65 than at 45 (25 vs 23 mpg). All cars demonstrated decreasing fuel economy beyond 65 mph (105 km/h), with wind resistance the dominant factor, and may save up to 25% by slowing from 70 mph to 55 mph. Log on to the website http://www.bgsoflex.com/mpg.html to complete the table of values for three of the cars. Make sure to input the correct drag coefficient, vehicle weight, and frontal area before computing fuel efficiency. You will leave all other categories at their default values. Car 1:______________ Car 2:______________ Car 3:______________ PART I (Making the Graph) 1. Using the calculated data sets, make accurate hand plots on graph paper with speed on the x-axis and MPG on the y-axis. Scale your axes so that your x-max goes up to 150 and y-max goes to 50. Use different colors/styles to distinguish each of the plots. 2. Now use your handheld calculator to create a scatter plot. Scale your windows to match your hand plots. Do the plots resemble a function you recognize? Discuss with your peers which function can be used to model the plots. Use a guess and check method to find a quadratic equation that fits one of your cars. 3. Use the quadratic regression function on your handheld to model each of the three plots. It is okay to round the coefficients to three decimal places. Plot the regression equations to check how well they fit. We will be using the equations to do some algebra and make predictions. PART II (Crunching the Numbers) 1. Using the methods learned in class, algebraically find the vertex for each of the regression equations. In the context of the problem situation, what does the vertex mean for each car? How do these values compare to the statistics stated in the opening paragraph? 2. Based on the look of the graph, do you think there is a time when fuel economy is ever zero? Use your graph to estimate the speeds that produce a fuel economy of zero.
3. After you make your estimates from the graph, use the quadratic formula to accurately calculate the speed that produces a fuel economy of zero. Round your answers to three decimal places. PART III (Making Predictions) 1. For the rest of the project, you will use the graph and equation for only one of the cars from part I and II. After choosing the car, use the equation to complete the table below for the predicted values. Add these values to your graph. Data from online calculator Predicted values from equation Data from online calculator 2. Check your predicted values from your equation to the actual calculated values from the online calculator. Use the table above to help you organize your work. How well do they match up? Explain why you think they are not the same. Add these new values to the graph, the shape should no longer be a parabola. 3. Since the actual data no longer fits our original equation, some of our work might be invalidated. Using your knowledge of polynomials and the shape of their graphs, find the appropriate regression equation that fits the new data. Work with a partner to help determine the equation that fits the best. You may need to change some of the numbers by hand to get a good fit. 4. With the new equation, now determine when fuel economy will be zero. How different is this answer compared to the one found in part II? Also, check to see if the speed that produces the best fuel economy is the same. Finally… The last line in the opening paragraph states that reducing speeds may save up to 25% by slowing from 70 mph to 55 mph. With the new equation, do the math to see what percentage is saved by reducing speeds from 70 mph to 55 mph for your chosen car. Write a paragraph summarizing and informing a non-math person the key findings of the project.
Occupy Exponential Functions Project: Minimum Wages Discouraged, but not Yet Demonstrating Students at Cal State Dominguez Hills bemoan their short-term job prospects. But nationwide protests that include criticism of education cuts have failed to drive many of them to action. October 28, 2011 | Hector Tobar That was the headline in the Los Angeles Times in October of 2011 during the apex of Occupy Movements flourishing across the country and even across the world. In this project you will examine the contents of the article and mathematically investigate some statements made by those who were interviewed. You will start by reading the article and then use the table of minimum wages to start your investigation. Entry-Level Position 1. Read the article from the Los Angeles Times - Make a list of the things you now know after reading the article and make a list of things you now wonder about. 2. After hearing each group's presentations, including your own, choose the top two things you are now wondering about and explain why you choose them. 3. Use at least two resources to define plutocracy and middle class worker? Make sure to cite your sources. 4. What do you think the author meant when he said, “The institutions of American meritocracy are teetering. But these students still think they have a fighting chance.” Ask someone in your family what they think this means and then ask a teacher at school what they think it means. Make sure to document their answers. Middle Management "Some of those positions in there are paying barely above minimum wage for students with degrees," she said, after speaking with various corporate and government recruiters. "You wonder: Did I go to college and work all this time just to make that?“ 5. Lets examine the history of minimum wages in California. Complete the table of values by determining the percent increase for each of the boosts in minimum wages. 6. Assuming that you are able to work 40 hours a week for weeks a year, how much would your yearly be if you only earn a minimum wage? 7. When you are attending college, you might not be able to work 40 hours a week, so go to the following website to find the average cost of attendance at any Cal State University: http://www.calstate.edu/sas/costofattendance Keep in mind that I know you might go to a community college, a UC school, or a private college, so the costs will be different for those institutions. Community college will be less expensive than Cal State, UC more expensive than Cal State, and a Private schools are usually more expensive than all of the schools. When the time comes, you will also apply for financial ad to lower those costs. We can talk about that later. For now, choose the Cal State that is nearest to you or one that you want to of living attend, and calculate how many hours you would need to work to cover the costs of living at home, living on-campus, and living off-campus. Upper Management 8. Take the data from the table and make a graph with year on the x-axis and minimum wage on the y-axis. To make things easier for you, let 1916=0, and adjust all the other years accordingly. 9. Using what you know about exponential functions, use a well thought out strategy to determine the equation that best fits the data. Remember, the general for of an exponential function is y=abx where a is the initial value and b is the multiplier that is related to the y-values.
Occupy Exponential Functions Project: Minimum Wages Upper Management cont. 10. Once you have a fit that makes you happy, use the equation to predict what the minimum wage will be when you graduate college. What will the minimum wage be in the year 2050 and 2100? Do you think these are answers are reasonable? 11. The average hourly salary of a teacher is about $50 an hour, when will the minimum wage be equal to that amount? CEO Do some research to investigate the hourly rate for the profession or career you are interested in. Use the average yearly salary of that profession and assume you work 40 hours a week for 50 weeks. Will getting a college degree help you accomplish those financial goals? Why or why not?
Historical Dates The following list contains the description of seven historical events. Without talking to anyone write down your estimate for how many years ago from today that event occurred. Make a guess if you do not know the answer. How will you decide who is the most knowledgeable historian?