Download
1 / 14
150 likes | 177 Vues
This study explores LiDAR-based methods to assess sunlight distribution in forests, crucial for tree growth, wildlife habitat, and ecological processes. The advanced techniques allow for precise prediction of shade and light conditions. By converting point clouds into voxel space and using ray tracing, accurate assessments can be made, with high prediction accuracy and application flexibility. The research presents innovative ways to visualize and simulate shading impacts, aiding forest management decisions.

E N D
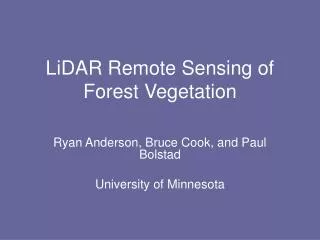
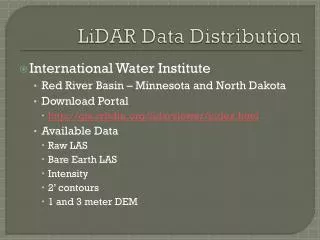
LiDAR-based assessment of sunlight distribution in forest ecosystems Demetrios Gatziolis USDA Forest Service PNW Research Station dgatziolis@fs.fed.us http://pnwfia.info/dgatziolis April 23, 2015
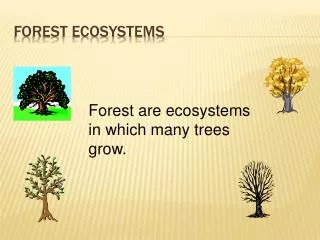
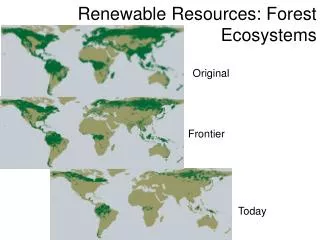
Motivation Diurnal and seasonal distribution of sunlight Influences tree growth, regeneration potential, wildlife habitat, stream temperature, and various other ecological processes Difficult to assess precisely and without bias Has management and policy implications Proliferation of publicly available, high-density LiDAR data 90+% of Oregon forests scanned at least once Potential for inexpensive, small area acquisitions (UAVs)
Current methods for assessing sunlight distribution • Developed for applications using bare earth representations • Degenerate 3D vegetation and terrain data into 2.5D • Consider trees opaque objects • Under canopy ground and lateral crown illumination are not defined • Incompatible with needs to determine which scene element(s) is responsible for shade on a particular location • Strongly biased (shade overestimation)
Elements of LiDAR technology Volumetric pulse – object interaction
Ray tracing in voxel space • Determine voxel resolution • Generate voxel representation • Calculate ray azimuth and elevation angle • Compute the ray’s ‘voxel walk’ • Stop if the ray intersects a ‘filled’ voxel • The process is computationally intensive and demanding of computer hardware resources (memory) • Efficient execution requires series of optimizations and execution in parallel (multithreading)
Point cloud to voxel space representation to light assessment via ray tracing
Prediction accuracy • N = 52 • RMSD = 0.145 (7.25%) • R2 = 0.92 • If outliers are excluded: • N = 50 • RMSD = 0.053 (2.65%) • R2 = 0.98
Application capabilities • Shade/light assessment possible anywhere high-density LiDAR data are available • User can specify time span, over the day and year, and number of solar positions to be considered during processing • Generate illumination/shade summaries in tabular or georeferenced raster format • Assess shade/light regimes at ground surface, at any point or level in the canopy, or at a constant above-ground offset • Restrict computations within an AOI
Application capabilities (cont.) • 3D visualizations of scene illumination conditions for a sequence of sun locations that can be assembled as an animation • Simulate the impact on shading of management activities such as harvest, relative to no-action alternatives • Delineate variable width buffers around stream reaches outside of which harvest won’t reduce shading by more than a specified threshold
Rays cast 5am : 8pm @ 12 min intervals Direct illumination of ground Direct illumination of ground and vegetation
Mainstem CampLick, Malheur NF • Percent direct solar illumination of ground surfaces • 25 ft resolution • 6 days, 20 rays / day • 2007 LiDAR acquisition • 4,133 billion laser returns • Distribution moments: • Min: 0.0% • Mean: 19.8% • Max: 100.0% • SD: 19.4% • Stream layer from R. Hassmiller
Shade management with variable-width harvesting buffer around a stream reach
Dynamic assessment of shade/sunlight in forest ecosystems using high-density LiDAR data Demetrios Gatziolis USDA Forest Service PNW Research Station dgatziolis@fs.fed.us http://pnwfia.info/dgatziolis April 23, 2015