Psychological Research Methods
Psychological Research Methods. Excavating Human Behaviors. History 2-4% Research methodology 8-10% Biological bases of behavior 8 – 10% Sensation Perception 6-8% Consciousness 2-4% Learning (Behaviorism) 7-9% Cognition (includes memory) 8-10%

Psychological Research Methods
E N D
Presentation Transcript
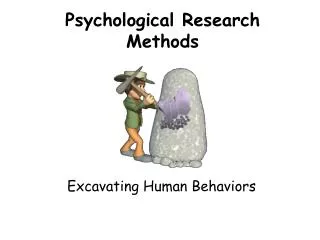
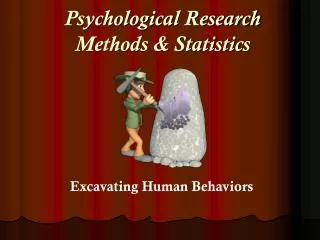
Psychological Research Methods Excavating Human Behaviors
History 2-4% • Research methodology 8-10% • Biological bases of behavior 8 – 10% • Sensation Perception 6-8% • Consciousness 2-4% • Learning (Behaviorism) 7-9% • Cognition (includes memory) 8-10% • Motivation/Emotion 6-8% • Development 7-9% • Personality 5-7% • Intelligence, testing 5-7% • Disorders, Treatment 10-14% • Social Psychology 8-10%
Why do we need science? Science is usually the best thing we have. Without science, we’d still be drilling holes in people’s heads to get the demons out. We’d hold on to our beliefs even if they were wrong.
What is Experimental Research? Explores cause and effect relationships. Has control and experimental groups Laboratory experiments are good at controlling variables. Eating too many bananas causes Constipation
Experimental Vocabulary • Independent Variable: factor that is manipulated (the medicine) (What you are doing to the subject) • In the “Ritalin” experiment, what was the independent variable?
Dependent Variable: factor that is measured (anxiety) In the Ritalin experiment, what was the dependent variable?
Extraneous Variables: outside factors that affect DV, that are not IV. (factors that screw up the experiment!) (other meds?, other sources of stress) What are some extraneous variables in the Ritalin experiment?
Confounding variables: 2 things that are hard to distinguish (nature versus nurture) Can you think of some confounding variables for the wearing red experiment?
Experimental Group: Group exposed to IV (those who get the pill) Who were the experimental groups in the Ritalin experiment?
Control Group: Group not exposed to IV (Those who get the sugar pill) Who was the control group in the straw experiment?
Placebo: inert substance that is in place of IV in Control Group (The sugar pill)
Placebo effect • A person’s expectations affect the independent variable.
What is operationalization? • A definition for the purposes of the experiment. • Ex: Do ugly people make less money than attractive people? We must define ugly in order to do the experiment! How did we operationalize “funny” in the straw experiment?
Steps in Designing an Experiment • Hypothesis • Pick Population: Random Selection then Random Assignment. • Operationalize the Variables • Identify Independent and Dependent Variables. • Look for Extraneous Variables • Type of Experiment: Blind, Double Blind etc.. • Gather Data • Analyze Results (with statistics) • Repeat (replication)
Organized sets of concepts that explain phenomena are a) independent variables b) dependent variables c) hypotheses d) theories
Let’s do an experiment. • Hypothesis: The red pill will reduce anxiety. • We operationalize the definition of anxiety to mean those whose doctors claim they suffer from anxiety. • We find 100 people who fit the operationalized definition
We randomly assign half the men to the experimental group and half the men to the control group. (Same with women). • I, the researcher, do not know which group will receive the medication and which will receive the placebo. That means this is a double-blind experiment. This will reduce experimenter bias.
The experimental group will receive the actual medication. The medication is called the independent variable. • The control group will receive a sugar pill (the placebo). • The research team will ask all participants to measure their level of anxiety on a scale from 1 to 10. Anxiety is the dependent variable (what is measured).
The control group will usually report a decrease in anxiety even though they received no medicine. This is called the placebo effect.
Now that the experiment phase is done, you must consider the extraneousvariables. This is the stuff that will screw up your experiment. Ex: what if the control group had a mean age much less than the experimental group? What if the 2 groups had a different percentage of women?
Our original hypothesis was: the red pill will reduce anxiety by 40%. • Results: The experimental group reported a mean of 10% reduction in anxiety versus a 5% reduction for the control group. • Theory: After several replications, the medicine has no significant effect on anxiety.
Aron Bridge Study • Describe the experimental group. • The control group. • Independent variable • Dependent variable
“giving the finger” study • IV? • DV? • Experimental group? • Control group?
Reliability and validity? • A finding is reliable if it can be replicated. If subsequent studies show that the red pill reduces anxiety then the findings are reliable, thus supporting the hypothesis. • A study is valid if it measures what it is supposed to measure. If our experiment measured hypertension instead of anxiety, then the test in invalid, even if it is reliable.
Is the TAKS valid and reliable? • If a similar TAKS test given to a group of 8th graders produces the same scores, then it’s reliable. • If students fail the 8th grade math TAKS because the wording is on the 10th grade level, then people might question the validity. A valid math test tests math, not reading level. Hmmmmm.
If your boyfriend picks you up every Friday at 8:00, is he reliable? • Does that mean he is a good boyfriend? (validity)
Descriptive Research What is going on in this picture? We cannot say exactly, but we can describe what we see. • Any research that observes and records. • Does not talk about relationships, it just describes. Thus we have…..
Types of Descriptive Research • The Case Study • The Survey • Naturalistic Observation • Cross-sectional study • Correlational study
The Case Study • Where one person (or situation) is observed in depth. What are the strengths and weaknesses of using a tragedy like the Columbine School Shootings as a case study?
Case study • Clive Wearing is a good case study in amnesia since his case is so rare and extreme.
Longitudinal studies • A subject is studied for a long long long time. Measures change over time. • Twins separated at birth are surveyed at ages 5, 10, 15, 20, 30 years.
Cross-sectional study • Different groups of people are compared and contrasted. • Blacks vs whites on attitudes towards psychotherapy • Poor vs. middle-class on extrovertedness
The Survey Method • Used in both descriptional and correlational research. • Use Interview, mail, phone, internet etc… • The Good- cheap, anonymous, diverse population, and easy to get random sampling (a sampling that represents your population you want to study).
Random Sampling sample census
Why do we survey? • One reason is the False Consensus Effect: the tendency to overestimate the extent to which others share our beliefs and behaviors.
Survey Method: The Bad • Low Response Rate • People Lie or just misinterpret themselves. • Wording Effects • Social desirability bias. How accurate would a survey be about the frequency of diarrhea? Homosexuality? Infidelity?
Naturalistic Observation • Observing and recording behavior in natural environment. • No control- just an observer. What are the benefits and detriments of Naturalistic Observation?
Correlational Research • Detects how well one variable predicts, not causes another variable. • Does NOT say that one variable causes another. There is a positive correlation between ice cream and murder rates. Does that mean that ice cream causes murder?
Correlation • Studies show that there is a strong correlation between how many books are present in a child’s home and college completion rate. • Do the books cause a person to complete college?
Correlation • Studies show that people who smoke marijuana have fewer health problems. • Does that mean that marijuana cures you of health problems?
Low Self-esteem Depression Depression Low Self-esteem Low Self-esteem Depression Distressing events or biological predisposition Correlation and Causation • Three possible cause-effect relations
Measured using a correlation coefficient. • A statistical measure of the extent to which two factors relate to one another • Between -1 and +1
Which correlation coefficient has the strongest relationship? The weakest? • A. .79 • B. -.88 • C. .09 • D. 3.6 • E. -.05 B has the strongest. E has the weakest D. is invalid
Analyze Results • Use measures of central tendency (mean, median and mode). • Use measures of variation (range and standard deviation).
Measures of variation – standard deviation What does deviate mean??