Download
1 / 18
180 likes | 295 Vues
Learn how linear transformations impact regression equations, analyze residuals to evaluate data points, and interpret predictive models effectively. Practice exercises included.

E N D
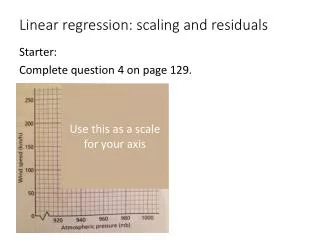
Linear regression: scaling and residuals Starter: Complete question 4 on page 129. Use this as a scale for your axis
Linear regression: scaling and residuals Starter:Answers. (a)
Linear regression: scaling and residuals Starter:Answers. • , • tells us that for every millibar increase in pressure, the predicted wind speed will drop by . • millibars is the only reliable estimate.
Linear regression: scaling and residuals Learning objectives: • Understand how a regression equation is affected by a linear transformation of either variable • Calculate and draw conclusions from residuals
Linear transformations This skill is useful if you want to take a model that you know works and use it with different units.
Example This is the data on midday temperature and ice cream sales. Assuming a linear model is suitable, calculate the least squares regression equation.
Example This is the data on midday temperature and ice cream sales. Now suppose you want to work in Fahrenheit (because you’re American or over 70). The temperature in Fahrenheit can be found from the temperature in Celsius using the linear scaling
Example This is the data on midday temperature and ice cream sales. Rearranging gives: Substituting gives:
Task Exercise C, Question 1 – Page 130 Time: 10 minutes!
Using Residuals Analysis of individual points can be achieved through considering the residual of that point. This can have two purposes: • To compare performance of individuals within a data set. • To assess whether a data point is erroneous or not. Be careful with your interpretations; use common sense and always refer to the context of the data.
Drivers:A = Ahmed B = Brian C = Carol Ahmed’s fuel consumption is well below those predicted by the line, whilst Brian’s is above. This means Brian’s driving appears to be highly economical whilst Ahmed’s is not. What can we deduce about each driver? Should Ahmed be sacked? No, we should be careful not to make rash judgements as there may be factors involved other than driving style; e.g. age/make of lorry may not be the same for all drivers, route of journey may change etc. Also, we should remember the sample size is very small.
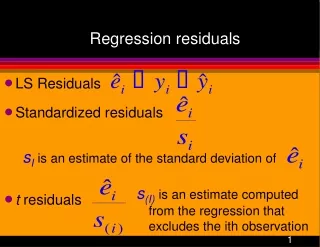
Calculating residuals numerically A residual is the difference the observed values of and those predicted by the regression equation.
Example This is the data on midday temperature and ice cream sales.
Example This is the data on midday temperature and ice cream sales.
Example This is the data on midday temperature and ice cream sales.
Example This is the data on midday temperature and ice cream sales. On one of the days the ice cream vendor was ill and went home early. Which data pair do you think represents this day?
Task Exercise D, Question 2 – Page 132 Time: 10 minutes!
Homework Test yourself – Page 134 Questions 1 & 3 Due Monday Two lucky people will be presenting their answers at the start of next lesson!