
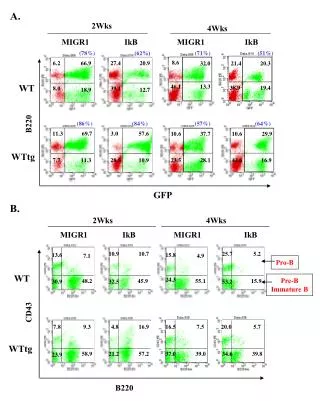
Analysis of B Cell Migration and Immunophenotyping Profiles in Development
This study investigates the migration patterns and immunophenotypic profiles of B cells at various developmental stages. Utilizing flow cytometry, we evaluate expression levels of specific markers like B220, CD43, and IkB, examining both immature and mature B cell populations. The data, presented with percentages for different cell types across weeks, reveal key insights into B cell behavior and differentiation processes. Our findings enhance the understanding of B cell development and its implications for immune responses.

Analysis of B Cell Migration and Immunophenotyping Profiles in Development
E N D
Presentation Transcript
A. B220 PE 2Wks 4Wks MIGR1 IkB MIGR1 IkB (62%) (78%) (71%) (51%) WT 27.4 20.9 8.6 6.2 66.9 32.0 21.4 20.3 10.9 10.7 25.7 5.2 13.6 15.8 7.1 4.9 B220 Pro-B 39.1 46.1 13.3 12.7 38.9 19.4 8.0 18.9 Pre-B Immature B 24.3 48.2 45.9 55.1 15.9 30.9 32.5 53.2 WTtg (86%) (84%) (57%) (64%) GFP 11.3 69.7 3.0 57.6 10.6 37.7 10.6 29.9 B. 7.8 9.3 4.8 16.9 16.5 7.5 20.0 5.7 2Wks 4Wks MIGR1 IkB MIGR1 IkB 7.7 11.3 28.5 10.9 23.5 28.1 42.6 16.9 58.9 21.2 57.2 37.0 39.0 34.6 39.8 23.9 WT CD43 WTtg B220