SIR
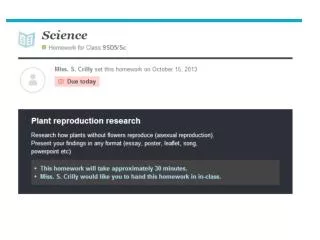
SIR. S – Describes asexual reproduction as reproduction where there is no fusion of gametes, and offspring are genetically identical to parents Well presented information I – Needs to define asexual reproduction Need to put into own words.

SIR
E N D
Presentation Transcript
SIR • S – Describes asexual reproduction as reproduction where there is no fusion of gametes, and offspring are genetically identical to parents • Well presented information • I – Needs to define asexual reproduction • Need to put into own words
Seed dispersal Seeds are dispersed in many different ways: • Wind • Explosion • Water • Animals • Birds • Scatter
Experiment • You will design an investigation into seed wing length and time to fall. Decide on factors to be controlled. Collect results in rough at first • What is the independent variable? (thing you are changing) • What is the dependent variable? (thing you are measuring) • What are the control variables? (things that stay the same)
Hypothesis • What do you predict will happen? • As seed length increases by _____, time to fall will ______ by _____
Checklist: Revealing patterns in data E (out of 8 marks) • Display your results in a simple table (1 mark) • Draw a bar chart/ graph using given axes and scales by your teacher (2 marks) • Record and draw a line graph for your results with the help of you teacher (3 marks) • Draw a line graph yourself that has some errors in scales and plotting of results (4 marks) • Correctly draw a line graph with correctly drawn scales and plotting of results (5 marks) • Draw a correct and appropriate line of best fit (6 marks) • Draw range bars or displaying data in scatter graphs to indicate spread of data (7 marks) • Correctly draw ranges bars and scatter graphs (8 marks)