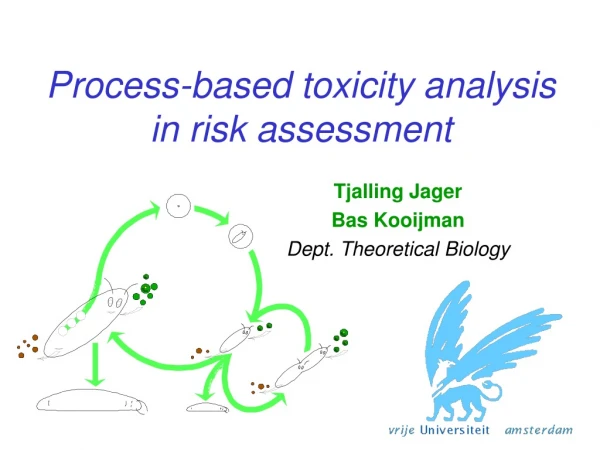
Process-based toxicity analysis in risk assessment
550 likes | 569 Vues
Explore the process-based toxicity analysis using Dynamic Energy Budget (DEB) theory for comprehensive risk assessment. Understand the relation between DEB, toxicants, and individuals' resource allocation, with advanced examples and laboratory insights.

Process-based toxicity analysis in risk assessment
E N D
Presentation Transcript
Process-based toxicity analysisin risk assessment Tjalling Jager Bas Kooijman Dept. Theoretical Biology
Contents • Dynamic Energy Budget (DEB) theory • Current procedures in (eco)tox • Introduction to DEBtox • Advanced examples • The DEB laboratory
Why DEB theory? How do individuals acquire and allocate their resources?
food faeces reserves 1- maturity offspring structure Dynamic Energy Budgets assimilation somatic maint. maturity maint.
DEB pillars • Quantitative theory; “first principles” • time, energy and mass balance • Life-cycle of the individual • links levels of organisation: molecule ecosystems • Comparison of species • body-size scaling relationships; e.g. metabolic rate • Fundamental to biology; many practical applications • (bio)production,(eco)toxicity, climate change …
Chemical-related projects at TB • Dutch government (RWS and RIVM) • biaccumulation metals in mussels; biomonitoring • toxicokinetics dioxin in humans • Dutch Technology Foundation STW • DEBdeg (bio)degradation of (toxic) compounds • DEBtum tumour induction/growth, analysis tox data • DEBtox indpop (reprod. modes in nematodes) • EU Projects • ModelKey effects on ecosystems and food chains • NoMiracle mixture toxicity More info: http://www.bio.vu.nl/thb/research/project/
“RISK” Risk assessment EXPOSURE EFFECTS
Process parameters at env. conditions Integrated model for system Exposure assessment Lab. experiments PEC
Contr. NOEC * LOEC Standard approaches 1. Statistical testing Response log concentration
What’s wrong with NOEC? • No statistically significant effect is not no effect • Effect at NOEC regularly 10-34%, up to >50% • Inefficient use of data • only last time point, only lowest doses • for non-parametric tests also values discarded OECD Braunschweig meeting 1996: NOEC is inappropriate and should be phased out!
EC50 Standard approaches 1. Statistical testing 2. Curve fitting Response log concentration
What’s wrong with ECx? Regression model is purely empirical • No estimation of process parameters • not possible to extrapolate to env. conditions • Inefficient use of data (last time point only) • ECx depends on exposure time
1 0.9 0.8 0.7 0.6 fraction surviving 24 hours 0.5 0.4 0.3 48 hours 0.2 0.1 0 0 0.1 0.2 0.3 0.4 0.5 0.6 0.7 concentration Effects change in time Nonylphenol, survival
chemical B internal concentration chemical C time Why does LC50 decrease? Toxicokinetics • effects are related to internal concentrations • kinetics depend on chemical chemical A
Daphnia chemical B small fish internal concentration large fish chemical C time Why does LC50 decrease? Toxicokinetics • effects are related to internal concentrations • kinetics depend on chemical • and species … chemical A
carbendazim pentachlorobenzene 2.5 140 120 2 100 survival 1.5 80 body length body length 60 1 40 0.5 20 cumul. reproduction cumul. reproduction 0 0 0 5 10 15 20 0 2 4 6 8 10 12 14 16 time (days) time (days) Sub-lethal EC10 in time does not necessarily decrease in time …
Consequences Procedures are inefficient • Test protocols yield more data than are used NOEC and LCx/ECx are not representative • Change in time, depending on species, body size, chemical and endpoint Standard exposure time leads to systematic error • in comparing effects • between chemicals (comparative RA, QSARs …?) • between species (SSDs … ?) OECD Braunschweig meeting 1996: Exposure time should be incorporated in data analysis
DEBtox OECD Braunschweig meeting 1996: Exposure time should be incorporated in data analysis Mechanistic models should be favoured if they fit the data • Windows software, version 1.0 in 1996, version 2.0.1 in 2004 • Included in draft ISO/OECD guidance on statistical analysis of ecotox data
Why process-based? Understand toxic effects • biology of organism and toxic mechanisms Match experimental set-up • e.g. degradation, pulse exposure Predictions for exposure situation • e.g. populations, food level, varying exposure
toxicokinetics DEBtox basics • Effect depends on internal concentration • one-compartment model
target parameter DEBtox basics • Chemical affects a parameter in DEB • e.g. maintenance rate toxicokinetics
DEB model DEBtox basics • Change in target parameter affects endpoint • survival, reproduction, growth toxicokinetics target parameter
assimilation maintenance costs growth costs reproduction costs hazard to embryo hazard (lethal effects) tumour induction tumour endocrine disruption Modes of Action food faeces assimilation reserves 1- somatic maint. maturity maint. maturity offspring structure
Windows version • User-friendly software, freely downloadable • Only for standard tests • acute survival • Daphnia reproduction • fish growth • algal population growth
Example: survival dieldrin concentration (µg/L) time (d)
0 d 1 d 2 d 3 d 4 d 5 d 6 d 7 d Example: survival dieldrin NEC 5.2 (2.7-6.9) µg/L Killing rate 0.038 L/(µg d) Elim. rate 0.79 d-1 Blank haz. 0.0084 d-1
Example: survival nonylphenol time concentration (mg/L)
0 hrs 24 hrs 48 hrs Example: survival nonylphenol NEC 0.14 (0.094-0.17) mg/L Killing rate 0.66 L/(mg h) Elim. rate 0.057 h-1
Example: survival nonylphenol NEC LC50 LC0
Example: repro cadmium Mode of action costs for repro NEC 3.3e-9 (0-0.017) mM Tolerance 4.7e-9 mM Max. repro 14 offspring/d Elim. rate 2.6e-9 d-1
Example: repro cadmium EC0 EC50
Advantages DEBtox For the standard software • Make efficient use of all data points • more accurate parameter estimates • reduce number of test animals … • More information obtained • ECx at any time point can be calculated • mode of action; crucial for population response • Characterisation of effects • time-independent NEC may replace NOEC and ECx
DEBtox extensions Simultaneous fits on more data sets • endpoints, chemicals, species … Fit deviating experimental data • degradation, pulse exposure … Extrapolations • time, food level, temperature, (species) … At this moment only available as MatLab scripts
Simultaneous fits Survival and body residues for cadmium (Heugens et al.) NEC on internal basis: 259 mg/kg dwt (202-321)
0 mg/L 1 0.8 3 mg/L 0.6 fraction surviving 0.4 4 mg/L 0.2 5 mg/L 10 mg/L 0 0 20 40 60 80 100 time (hours) Extrapolation From continuous exposure to a 20-hour pulse
simultaneous fits Survival for 5 OP esters (data De Bruijn & Hermens) Same NEC, elim. rate, killing rate, receptor repair rate Different affinity for receptor
120 body size 1 100 0.8 80 0.6 60 0.4 40 0.2 20 0 0 0 2 4 6 8 10 12 14 16 0 5 10 15 survival reproduction simultaneous fits Reproduction test with cadmium (data Heugens et al.) Mode of action decrease assimilation
0.4 0.3 population growth rate (1/day) 0.2 0.1 0 0 0.05 0.1 0.15 0.2 concentration Extrapolations To populations and limiting food 90% food 80% food
Body length Cumulative offspring Fraction surviving High food Low food Simultaneous fits Fenvalerate pulse at two food levels (data Pieters et al.) • Mode of action: assimilation • NEC survival: 0.42 µg/L • NEC growth/repro: 0.051 µg/L • Insights • intrinsic sensitivity independent of food • chemical effects fully reversible
NEC impact population growth rate PEC concentration Opportunities 1:Relevant endpoint • ecologically relevant • time independent • integrate endpoints • comparable between chemicals
impact impact PEC PEC Opportunities 1:Relevant endpoint • ecologically relevant • time independent • integrate endpoints • comparable between chemicals NEC population growth rate concentration
exposure time survival time Opportunities 2:Match exposure scenario
Opportunities 3:Reduce testing needs? • Use all of the data points • more data points per parameter • less animals needed • Less need to discard ‘poor’ data • disappearance of test compound • change in body weight of test organism • combine low-quality data sets • Less need for new tests • better extrapolations from lab data • opportunities for QSAR development …