Download
1 / 15
150 likes | 196 Vues
This study delves into the intricacies of exchange rates, trade, and multinational activities. It explores serving foreign markets, production choices, exchange rate risks, and currency transactions. Comprehensive data analysis and trends from various sources enhance the understanding of global economic dynamics.

E N D
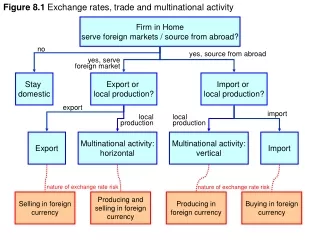
Figure 8.1 Exchange rates, trade and multinational activity Firm in Home serve foreign markets / source from abroad? no yes, source from abroad yes, serve foreign market Stay domestic Export or local production? Import or local production? export import local production local production Export Multinational activity: horizontal Multinational activity: vertical Import nature of exchange rate risk nature of exchange rate risk Selling in foreign currency Producing and selling in foreign currency Producing in foreign currency Buying in foreign currency
Figure 8.2 Some exchange rates; daily data, 2000 – 2011 Data source: www.federalreserve.gov
Figure 8.3 Australia – USA; spot and forward exchange rates of US dollar, 1976-2011 Data source: IFS.
Figure 8.4 Global foreign exchange market turnover, 1998 – 2010 Data source: BIS (2010), triennial central bank survey
Figure 8.5 Most used currencies on the foreign exchange market, 1998 – 2010 Data source: BIS (2010); * Because two currencies are involved in each transaction, the sum of the percentage shares of individual currencies totals 200 percent instead of 100 percent.
Figure 8.6 Exchange rates and prices, 1960-2009 Calculations based on World Development Indicators online; 64 observations; the line has a 45 slope.
Figure 8.8 De facto exchange rate arrangements, April 30, 2010 Data source: IMF (2010, Appendix II); selected countries listed for each regime, see also Table 23.1
Figure 8.9 US dollar: effective exchange rates, 1973-2011 Data source: www.federalreserve.gov
Figure 8.9 US dollar: effective exchange rates, 1973-2011 Data source: www.federalreserve.gov
Figure 8.10 Out-of-sample exchange rate forecasting Data source: Meese and Rogoff (1983)
Figure 8.11 Canada; interest rates and inflation rate (CPI), 1970 – 2011 Data source: IFS; bank rate (end of period) and cpi (% change), monthly data
Figure 8.12 UK; interest rates and term structure, 1980-2011 Data source: IFS; 3 and 6 month Paris Interbank Offer rate
Figure 8.14 Australia – USA: 12-month covered interest parity Data source: IFS; shown interest rates are interbank offered rates, 1986-2005