Fundamentals of Economics
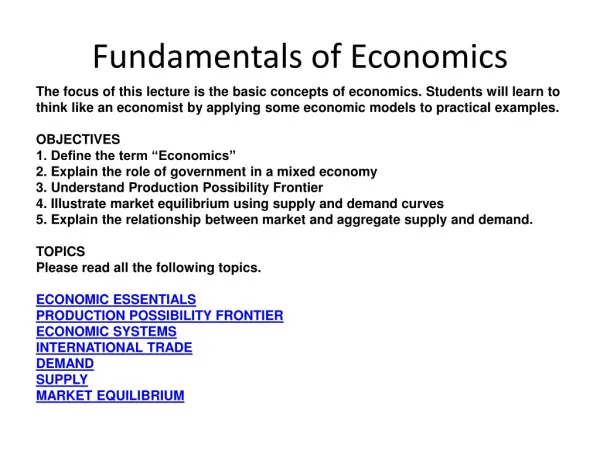
Fundamentals of Economics. The focus of this lecture is the basic concepts of economics. Students will learn to think like an economist by applying some economic models to practical examples. OBJECTIVES 1. Define the term “Economics” 2. Explain the role of government in a mixed economy

Fundamentals of Economics
E N D
Presentation Transcript
Fundamentals of Economics The focus of this lecture is the basic concepts of economics. Students will learn to think like an economist by applying some economic models to practical examples. OBJECTIVES 1. Define the term “Economics” 2. Explain the role of government in a mixed economy 3. Understand Production Possibility Frontier 4. Illustrate market equilibrium using supply and demand curves 5. Explain the relationship between market and aggregate supply and demand. TOPICS Please read all the following topics. ECONOMIC ESSENTIALS PRODUCTION POSSIBILITY FRONTIER ECONOMIC SYSTEMS INTERNATIONAL TRADE DEMAND SUPPLY MARKET EQUILIBRIUM
Economic Essentials Economics is a social science. It studies how to efficiently allocate the limited resources to satisfy unlimited human wants. Since resources are scarce, but wants are unlimited, we learn to make choices. When choices are made, certain wants must be sacrificed. For example, when you decided to take this class, you are prepared to give up some of your leisure time. The leisure time you give up in order to finish this class plus what you would have otherwise used the tuition money for is your opportunity cost for this class. Since every one of you has decided to take this class, that means you valued the benefit of this class more than the cost (which is the time you give up and what you would have used the tuition money for). Economists are making wise choices by comparing the extra benefit to the corresponding extra cost at each decision. The extra benefit is called Marginal benefit (MB); the extra cost is called Marginal cost (MC). You should only choose an item when its MB is greater or equal to its MC. Marginal Rule: MB> or = MC, then do it; MB < MC, then don’t do it.
Production Possibility Frontier In any society, people have to deal with limited resources by comparing their opportunity costs. If a country choose to produce more weapons, then this country must give up some of the other goods, say food. It is because resources like labor or capital must be relocated to produce weapons. In other words, an economy producing only weapons and food can only increase its weapons output by reducing its food output. (Under the assumption of fixed technological level, full employment and full efficiency). The combinations of weapons and food can be illustrated by using a production possibility frontier (PPF) or called production possibility curve (PPC). Most of the PPF curves are concave due to the inadaptability of the resources. The law of increasing opportunity cost states: as the production of one good rises, the opportunity cost of producing that good increases. However, this country can have more weapons and food at the same time by a) improving its technological level, b) having economic growth, C) trading with another country.
Production Possibility Frontier The PPC curve shown in the graph is constructed using the above data. Assuming this country produced only two products: pizzas and robots; this country's resources are fixed in quantity and quality; this country's technology level is fixed and production cost is at its minimum. Every point on the curve is an efficient point. The purple area is the attainable area where this country is capable of reaching, but worse off than any point on the PPC. The grey area is the unattainable area where this country is not capable of reaching at this point, but the country will be better off by moving into this area.
Economic Systems Capitalism and socialism: • From the PPF, we understand that it is impossible to produce as much of every good as we might want, so choices must be made. Different economic systems will make different choices. There are two major economic systems: capitalism and socialism, but most countries use some combination of the two known as a mixed economy. • In pure or laissez-faire capitalism, there is private ownership, and markets and prices coordinate and direct economic activity. In socialism, there is public (state) ownership, and central government planning coordinates economic activity. Socialists believe that government decision makers are persons who promote the best interests of society as a whole and make every effort to obtain the information needed to make the right decision. However, capitalists think that government is more likely to respond to producers who have the political power to lobby congress than to consumers who do not lobby. Central government planning may favor special –interest groups at the expense of the rest of the society. Therefore, government’s role should be limited to order maintenance. Pure capitalism is an abstract model. The economy is self-regulating. • The U.S. system is a mixed economy, but closer to pure capitalism. There are two major markets (product and resources market), and three major sectors (household, business, government) in the domestic economy. In the product market, goods and services are produced in the business sector and sold to households. In return, businesses get revenue from the household as they pay for the goods and services. In the resources market, resources are supplied by the households. Businesses pay for the desired resources, which produce good and services. In return, households get income, which they will use to pay for the goods and services. U.S. government collects taxes from both sectors, buys goods and services from the businesses, pays for resources they employed, provides services and will intervene by their policies according to different market situations.
International Trade From the PPF curve, we understand that trading can expand PPF outward. Domestic trading is comparatively simpler than international trading. Since different countries have different standards and regulations on various products, exporters and importers have to learn to cope with them. International trading has to involve customs, and quota, tariffs, and some other barriers limiting producers’ right. A large number of producers are engaged in international trading because of the comparative advantages. Look around your household, you probably have a lot of imported items. Why did you choose to buy foreign goods instead of U.S. goods? The answer is very simple: imports are cheaper. Producers decided to move production to other countries for the same reason. Countries with abundant labor resources have comparative advantage on labor intensive goods, such as clothing, shoes, and most of the consumer goods. Therefore these countries will produce consumer goods and export them to the U.S. The U.S. has comparative advantage on many capital goods (tools and equipment used to produce consumer goods), therefore the U.S. exports capital goods and imports consumer goods. Through international trading, the PPF of U.S. can expand outward.
Demand Demand (D) is a schedule that shows the various amounts of product consumers are willing and able to buy at each specific price in a series of possible prices during a specified time period. Quantity demanded (Qd) is the amount of a good or service that individuals are willing and able to buy at a particular price at a particular time. In another words, demand is the quantity demanded at all prices during a specific time period. A change in price will change the quantity demanded, not the demand. Any other factors other than price change will change the demand. The law of demand: As price of a good increases, the quantity demanded of the good falls, and as the price of a good decreases, the quantity demanded of the good rises, ceteris paribus. Restated: there is an inverse relationship between price (P) and quantity demanded (Qd). Explanation of Law of Demand: 1.Substitution Effect: As the price of product A increases, product A is comparatively more expensive than product B if B's price remain constant. Therefore, consumers will substitute B for A, causing the consumption of A to decrease. 2. Income Effect: higher price will lower the consumption power of your income and decrease the quantity demanded. 3. Law of diminishing marginal utility: As a person consumes more of a good, the additional utility of consuming more will eventually decreases. This means that to encourage additional consumption, price must fall.
Demand Curve It is the graphical of presentation of the relationship between the quantity demanded of a good and the price of the good. It is a downward sloping curve. The demand curve shown here is drawn according to the following data: Price =P Quantity demanded=Qd P $2 4 6 8 10 Qd 40 30 20 10 0 Price and quantity demanded are negatively related. Individual Demand Vs Market Demand: Market demand is the summation of all of the individual demand curves for a particular item. The transaction from an individual to a market demand schedule is accomplished by summing individual quantities at various price levels. Aggregate demand (AD) is not the same as market demand. AD is a schedule that shows the various amount of real domestic output (GDP) which domestic and foreign buyers will desire to purchase at each possible price level.
Determinants of Demand When price changes, quantity demanded will change. That is a movement along the same demand curve. When factors other than price changes, demand curve will shift. These are the determinants of the demand curve. 1. Income: A rise in a person’s income will lead to an increase in demand (shift demand curve to the right), a fall will lead to a decrease in demand for normal goods. Goods whose demand varies inversely with income are called inferior goods (e.g. Hamburger Helper). 2. Consumer Preferences: Favorable change leads to an increase in demand, unfavorable change lead to a decrease. 3. Number of Buyers: the more buyers lead to an increase in demand; fewer buyers lead to decrease. 4. Price of related goods: a. Substitute goods (those that can be used to replace each other): price of substitute and demand for the other good are directly related. Example: If the price of coffee rises, the demand for tea should increase. b. Complement goods (those that can be used together): price of complement and demand for the other good are inversely related. Example: if the price of ice cream rises, the demand for ice-cream toppings will decrease. 5. Expectation of future: a. Future price: consumers’ current demand will increase if they expect higher future prices; their demand will decrease if they expect lower future prices. b. Future income: consumers’ current demand will increase if they expect higher future income; their demand will decrease if they expect lower future income. Review: A change in quantity demanded is caused by a change in its own price of the good. A change in demand is caused by a change in determinants.
Supply Supply (S) is a schedule, which shows amounts of a product a producer is willing and able to produce and sell at each specific price in a series of possible prices during a specified time period. Quantity supplied (Qs) is the amount of a product that producers are willing and able to produce and sell at a particular price at a particular time. In another words, supply is the quantity supplied at all prices during a specific time period. A change in price will change the quantity supplied, not the supply. Any other factors other than price change will change the supply. The law of supply Law of supply states: As price of a good increases, the quantity supplied of the good rises, and as the price of a good decreases, the quantity supplied of the good falls, ceteris paribus. Restated: there is a direct relationship between price (P) and quantity supplied (Qs). Explanation of Law of Supply If the product cost is given, a higher price means greater profits and thus an incentive to increase the quantity supplied. Price and quantity supplied are directly related.
Supply Curve Supply curve is the graphical representation of the relationship between the quantity supplied of a good and the price of the good. It is an upward sloping curve. The supply curve shown here is drawn with the following Data: Price = P Quantity Supplied=Qs P $ 2 4 6 8 10 Qs 0 10 20 30 40 Price and quantity supplied are positively related. Individual Firm’s Supply Vs Market Supply Market supply is the summation of the individual firm’s entire supply curve for a particular item. The transaction from an individual to a market supply schedule is accomplished by summing individual firm’s quantities at various price levels. Aggregate supply (AS) is not the same as market supply. AS is a schedule showing level of GDP available at each possible price level.
Determinants of Supply When price changes, quantity supplied will change. That is a movement along the same supply curve. When factors other than price changes, supply curve will shift. Here are some determinants of the supply curve. 1. Production cost: Since most private companies’ goal is profit maximization. Higher production cost will lower profit, thus hinder supply. Factors affecting production cost are: input prices, wage rate, government regulation and taxes, etc. 2. Technology: Technological improvements help reduce production cost and increase profit, thus stimulate higher supply. 3. Number of sellers: More sellers in the market increase the market supply. 4. Expectation for future prices: If producers expect future price to be higher, they will try to hold on to their inventories and offer the products to the buyers in the future, thus they can capture the higher price. Review: A change in quantity supplied is caused by a change in its own price of the good. A change in supply is caused by a change in determinants.
Market Equilibrium When the supply and demand curves intersect, the market is in equilibrium. This is where the quantity demanded and quantity supplied are equal. The corresponding price is the equilibrium price or market-clearing price, the quantity is the equilibrium quantity. Putting the supply and demand curves from the previous sections together. These two curves will intersect at Price = $6, and Quantity = 20. In this market, the equilibrium price is $6 per unit, and equilibrium quantity is 20 units. At this price level, market is in equilibrium. Quantity supplied is equal to quantity demanded ( Qs = Qd). Market is clear.
Surplus and Shortage If the market price is above the equilibrium price, quantity supplied is greater than quantity demanded, creating a surplus. Market price will fall. Example: if you are the producer, you have a lot of excess inventory that cannot sell. Will you put them on sale? It is most likely yes. Once you lower the price of your product, your product’s quantity demanded will rise until equilibrium is reached. Therefore, surplus drives price down. If the market price is below the equilibrium price, quantity supplied is less than quantity demanded, creating a shortage. The market is not clear. It is in shortage. Market price will rise because of this shortage. Example: if you are the producer, your product is always out of stock. Will you raise the price to make more profit? Most for-profit firms will say yes. Once you raise the price of your product, your product’s quantity demanded will drop until equilibrium is reached. Therefore, shortage drives price up. If a surplus exist, price must fall in order to entice additional quantity demanded and reduce quantity supplied until the surplus is eliminated. If a shortage exists, price must rise in order to entice additional supply and reduce quantity demanded until the shortage is eliminated.
Surplus and shortage Government Regulations Government regulations will create surpluses and shortages in the market. When a price ceiling is set, there will be a shortage. When there is a price floor, there will be a surplus. Price Floor: is legally imposed minimum price on the market. Transactions below this price is prohibited. Policy makers set floor price above the market equilibrium price which they believed is too low. Price floors are most often placed on markets for goods that are an important source of income for the sellers, such as labor market. Price floor generate surpluses on the market. Example: minimum wage. Price Ceiling: is legally imposed maximum price on the market. Transactions above this price is prohibited. Policy makers set ceiling price below the market equilibrium price which they believed is too high. Intention of price ceiling is keeping stuff affordable for poor people. Price ceiling generates shortages on the market. Example: Rent control.
Changes in equilibrium price and quantity Equilibrium price and quantity are determined by the intersection of supply and demand. A change in supply, or demand, or both, will necessarily change the equilibrium price, quantity or both. It is highly unlikely that the change in supply and demand perfectly offset one another so that equilibrium remains the same. Examples: These examples are based on the assumption of Ceteris Paribus. 1) If there is an exporter who is willing to export oranges from Florida to Asia, he will increase the demand for Florida’s oranges. An increase in demand will create a shortage, which increases the equilibrium price and equilibrium quantity. 2) If there is an importer who is willing to import oranges from Mexico to Florida, he will increase the supply for Florida’s oranges. An increase in supply will create a surplus, which lowers the equilibrium price and increase the equilibrium quantity. 3) What will happen if the exporter and importer enter the Florida’s orange market at the same time? From the above analysis, we can tell that equilibrium quantity will be higher. But the import and exporter’s impact on price is opposite. Therefore, the change in equilibrium price cannot be determined unless more details are provided. Detail information should include the exact quantity the exporter and importer is engaged in. By comparing the quantity between importer and exporter, we can determine who has more impact on the market.
Changes in Equilibrium Price and Quantity In the first graph, supply is constant, demand increases. As the new demand curve (Demand 2) has shown, the new curve is located on the right hand side of the original demand curve. The new curve intersects the original supply curve at a new point. At this point, the equilibrium price (market price) is higher, and equilibrium quantity is higher also. In the second graph, demand is constant, and supply increases. As the new supply curve (SUPPLY 2) has shown, the new curve is located on the right side of the original supply curve. The new curve intersects the original demand curve at a new point. At this point, the equilibrium price (market price) is lower, and the equilibrium quantity is higher. In this last graph, the increased demand curve and increased supply were drawn together. The new intersection point is located on the right hand side of the original intersection point.