Download
1 / 29
330 likes | 633 Vues
July 12 th , 2011. An Overview of Solving Spatial Problems Using ArcGIS. Linda Beale, Jian Lange. Real World Example. Using Spatial Analysis for Search and Rescue. Objectives. The Basis of Spatial Analysis. Spatial relationships. - Containment. LAX is 3.2 miles west off Hwy 105.

E N D
July 12th, 2011 An Overview of Solving Spatial Problems Using ArcGIS Linda Beale, Jian Lange
Real World Example Using Spatial Analysis for Search and Rescue
The Basis of Spatial Analysis • Spatial relationships - Containment LAX is 3.2 miles west off Hwy 105 Hwy 405 is adjacent to the coast - Adjacency Los Angeles is contained in CA - Distance - Selection and Statistics
The Spatial Analysis Workflow Frame the question Explore the Data Choose the method Perform the analysis Examine Results Break it down Audience? Review question Common approaches Data suitable? Share analysis Automation: Use models, code Representation Distribution Accuracy Scale Format Visually but … importantly, statistically 5
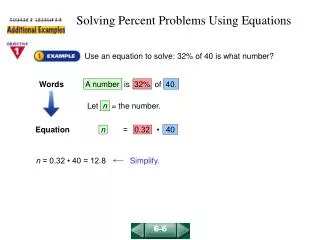
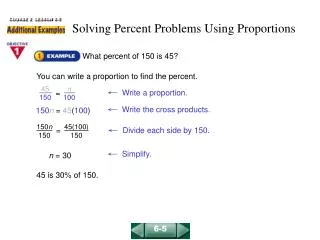
How can we estimate values for a whole area? • What is a suitable location for …? Spatial Analysis is about Solving Problems • What is inside an area? • What is nearby? • Where are the events concentrated? • Where do things move over time? • Why things occur where they do?
What is inside an area? • Step 1: Frame the question: How do gas prices differ in different counties in Southern California?
What is near by? Step 1: Frame the question Where is the closest gas stations for each freeway exit?
What is near by? Step 2: Explore the data Gas station locations
What is near by? Step 2: Explore the data Freeway exits
What is near by? Step 3: Choose a Method 1) Create a (1 mile) buffer around freeway and locate gas stations inside
What is near by? Step 3: Choose a Method (within Buffer)
What is near by? Step 3: Choose a Method 2) Calculate the crow’s flight (Euclidean distance)from each exit with the Near tool.
What is near by? Step 3: Choose a Method (Crow’s Flight)
What is near by? Step 3: Choose a Method 3) Use network analysis tools (Network Analyst – Closest Facility)
What is the spatial pattern? • Step 1: Frame the question: Are there areas where gas stations have similar prices (high or low)?
Where are clusters? • Step 1: Frame the question: Where are areas with high gas prices and where are areas with low prices ?
How do clusters move over time? • Step 1: Frame the question: • When the gas price goes up, do gas stations in different areas increase the price at the same time? • If not, which areas are leading the pack? Which areas are trailing behind and catching up later?
What contributes to the spatial pattern and by how much? • Step 1: Frame the question: Why the gas price is higher in Beverly Hills than in Pomona ?
Traffic Related Air Pollution Demo Linda Beale
Overview of our analysis Frame the question Explore the Data Choose the method Perform the analysis Examine Results • We had a clear objective • Data availability and structure guided our choice of appropriate analysis techniques • We investigated a variety of different approaches • We validated our results
Analysis and Geoprocessing • Spatial Analysis: • ArcToolbox • Extensions • Tip : Use the search
ModelBuilder • Create a new toolbox Add a new tool
Web resources Resource Center ArcGIS.com
The Collaborative Workflow To help solve real problems by real people Analysis GIS Professionals 46
Final comments • Analysis is not the end of the story • Think about how you display the results • A data frame is not a map • Your map should be changed to suit: • Purpose and audience Remember… • The accuracy of analysis results is completely dependent on the input data (GIGO)
Questions? Please complete the session evaluations at: http://www.esri.com/sessionevals