
Uploaded by
masato
1 SLIDES
122 VUES
10LIKES
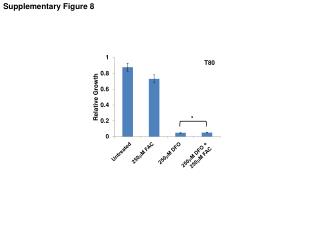
Comparison of FAC and DFO Treatments in Untreated Cells at Figure 8 - T80
DESCRIPTION
This supplementary figure shows the effects of 250mM FAC, 250mM DFO, and the combined treatment on untreated cells at timepoint T80. The comparison highlights the differences in cellular response to these treatments.
Download
1 / 1
Télécharger la présentation 
Comparison of FAC and DFO Treatments in Untreated Cells at Figure 8 - T80
An Image/Link below is provided (as is) to download presentation
Download Policy: Content on the Website is provided to you AS IS for your information and personal use and may not be sold / licensed / shared on other websites without getting consent from its author.
Content is provided to you AS IS for your information and personal use only.
Download presentation by click this link.
While downloading, if for some reason you are not able to download a presentation, the publisher may have deleted the file from their server.
During download, if you can't get a presentation, the file might be deleted by the publisher.
E N D
Presentation Transcript
Supplementary Figure 8 T80 Untreated 250mM FAC 250mM DFO 250mM DFO + 250mM FAC


More Related