Download
1 / 43
430 likes | 561 Vues
Environmental Business International. Environmental Market Outlook to 2010 Market Development & Deployment of Technology. Briefing for EPA Innovation Symposium Integrated Approaches for Energy, Climate and Environment January 2008 Chapel Hill, NC Prepared by

E N D
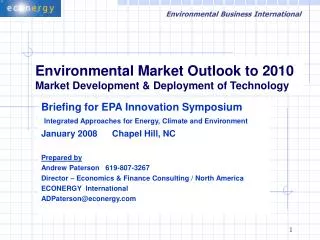
Environmental Business International Environmental Market Outlook to 2010Market Development & Deployment of Technology Briefing for EPA Innovation Symposium Integrated Approaches for Energy, Climate and Environment January 2008 Chapel Hill, NC Prepared by Andrew Paterson 619-807-3267 Director – Economics & Finance Consulting / North America ECONERGY International ADPaterson@econergy.com
ECONERGY’S BUSINESS Traded on London AIM (ECN); Raised US$100M in 2006 • Clean Energy Development & Operations • Early Stage Project Finance • Carbon Markets • Consulting Expertise in Energy / CDM By Andrew Paterson
Opening Observations: Drivers & Multi-media Linkage • Even with changeover in Congress, new environmental legislation is on a slow track (e.g., no RCRA, Superfund bills). • High market segment growth (>2x-3x GDP) drives returns needed to recover costs and risks of technology innovation. • Many environmental sectors are mature and driven by GDP and demographics: water resources, solid waste, land use. • Back-end cleanup, e.g., remediation, air, hazardous waste, are not high growth niches. Much work has been completed (USTs). • Redevelopment of aging infrastructure is becoming a bigger driver, including energy and grid, water, urban transport, gov’t. • Interest rates are low, allowing ample financing for infrastructure. • Water shortages have appeared, but have not triggered large scale budget increases yet, which will be needed for innovation. • Linkage: Innovative energy technologies look to be a high growth niche, creating higher water demands, affected by GHG policy. • Regulatory uncertainty freezes investment and market growth. • Better long-term policies mobilize more private capital. By Andrew Paterson
U.S. Environmental Market Growth Rides on Resources Environmental legislation in 1970s and 1980s helped drive growth, but economic recovery, manufacturing excellence in the 1990s became larger drivers as cleanup markets topped out. Exports comprise about 10% of the total market, concentrated in air, water equipment. Global growth draws on resources. By Andrew Paterson
Success leads to a cresting of some markets… Progress on Emissions L.A. Sees Cleanest Air Quality on Record By TIM MOLLOY, The Associated Press Updated: 7:53 a.m. ET Nov. 5, 2004 -- LOS ANGELES - With a little help from good weather, air in the Los Angeles was the cleanest on record this year, regulators said Thursday. Still, the region's air quality remained the worst in the nation by one key measure, said Sam Atwood, a spokesman for the South Coast Air Quality Management District. The region benefited this year from weather that isn't conducive to smog, including cooler temperatures, fog, low clouds and weak inversion layers. Cleaner cars, industries and businesses also improved air quality, officials said. "The weather was a major factor this year, there's no denying that," Atwood said. "We're headed in the right direction but we have to definitely not rest on our laurels." Southern California, which has struggled with air pollution for half a century, historically has its worst smog between May 1 and Oct. 31. This year, there were only 27 days during that period when the region's ozone level, averaged over one hour, exceeded the federal Environmental Protection Agency's standard. Overall, the region violated the one-hour standard 68 days last year, officials said. Ground-level ozone, a precursor to smog, causes respiratory illnesses that can be especially harmful to the elderly, children and people with asthma. The Los Angeles area still had the highest peak level of ozone averaged over an eight-hour period a newer, stricter EPA measure than the one-hour standard. Can we handle success ? By Andrew Paterson
Compliance X X X …Still work to be done – fear not ! Clean air Land restoration Safe water Communities … and Storm Recovery ! By Andrew Paterson
Some Service Sectors Declining; Water, Energy Growing Backend treatment services – remediation, hazardous waste management, analytical labs and related consulting peaked in the 1980s and will continue to decline. Energy and water niches, process technologies look to grow with demographic and economic drivers. Source: Environmental Business Journal By Andrew Paterson
Global Markets Driven by Demographics, Energy Needs Energy and water niches look to grow worldwide to meet demands of surging populations. Over 25 “mega-cities” (> 10 million people) will appear by 2020, up from 12 now. The U.S. is almost 40% of the global market, with Western Europe comprising 30%, and Japan at 17%. By Andrew Paterson
Market Traits (Growth, Size) Affect Approaches • Different market traits – growth rate, competitive dominance, nature of purchasing decisions – call for different financing approaches, incentives. • Clean energy and instruments offer much higher growth rates (>20% per year) to allow recovery of equity investments (Group A). • Larger markets, like water treatment and resource recovery with steadier growth rates, that match the economy and demographic trends, allow for some debt funding and project finance, often with some public finance (Group B). Municipal ownership is high in these sectors precluding venture capital. Tax exempt bonds, international lending are more typical. • Declining markets, like remediation and consulting, must rely on asset conversion, e.g. brownfield development or facility turnaround, to generate returns since losses on operations are common (Group C). • For international markets, project debt financing is a paramount factor since markets and enforcement mechanisms are not well-developed. By Andrew Paterson
U.S. Enviro Markets 2010 Forecast: Growth vs. Size (I) • Small markets growing faster: Process Technology, Instruments, Energy, Water • Large markets growing basically with the economy: Infrastructure, Services • Shrinking markets: Traditional backend Cleanup and Remediation Source: EBI By Andrew Paterson
U.S. Enviro Markets 2010 Forecast: Growth vs. Size (II) • Small markets growing faster: Process Technology, Instruments, Energy, Water • Large markets growing basically with the economy: Infrastructure, Services • Shrinking markets: Traditional backend Cleanup and Remediation Source: EBI By Andrew Paterson
U.S. Regional Differences Remain Sharp into 2008 Difficult to frame national solutions when country remains divided. • Sharp regional differences drive water resource and environmental policies, led by Governors / states: • Energy use patterns, electricity prices, and transmission constraints • Levels of urbanization, air pollution, vehicle use • Availability of renewable resources (hydro, biomass, wind, solar) • Water use and supply, and agricultural (“CAFO”) priorities • Land use management and pressures for suburban development • Political leadership at state and local level will differ from federal agencies regardless of party affiliation. • Priorities for urban states diverge from suburbs and rural states. • Federal policy (e.g., EPA, FERC, DOI) and funding of key programs will struggle to balance regional priorities. “Producers” vs. “Consumers”. • Hurricane recovery, climate change will aggravate regional differences. By Andrew Paterson
Red States Petrochemicals & NASCAR! Producer states: Opportunities for expansion of energy infrastructure (pipelines, LNG) Roads & suburbs; SUVs, soccer Transportation and siting projects More energy exploration State PUCs approve “clean coal” plants (with scrubbers, CCS) Water + drought management Real estate development and more access to federal lands Blue States High-tech & Hockey User states: Need upgrades of energy infrastructure: pipelines and transmission, urban load Mass transit, traffic congestion Hybrids and “clean fleets” More EE, “green energy” policies More lawsuits on coal power plants (feud over NSR) Water infrastructure makeovers “Restoration Economy” and land use conservation Different regions, different policies States: “Red” (Bush) vs. “Blue” (Gore/Kerry) Different priorities will alter market and technology opportunities. By Andrew Paterson
2004 Result: “Red”(Bush) vs. “Blue”(Kerry or Gore) The U.S. remains sharply divided after 2004 election…in Congress also. Result in 2000 Bush: 271 Gore: 267 Result in 2004 Bush: 286 Kerry: 252 2000 Census + 7 for red Only +8 shifted, net http://www.2001inaugural.com/2000-election-map.html By Andrew Paterson
2004 Result BY COUNTY (Red vs. Blue) By Andrew Paterson
2004 Result Linked to Superfund Sites… Superfund Sites concentrated in Blue States and Blue districts in red states. By Andrew Paterson
Environmental Markets by Media 2003 12 EPA Budget (FY05): $1.0 $2.9 $1.8 $1.3 $0.7 $7.7 13% 38% 23% 17% 9% 100% By Andrew Paterson Source: Environmental Business Journal
EPA Budget Peaked in 2004… Bottoming out ?- sizeable cutbacks in Infrastructure budgets 12 By Andrew Paterson Source: EPA Budget in Brief, 2008
Finance and Environmental Technology How do market characteristics affect financing options and trends for technology innovation ? By Andrew Paterson
Technology Matrix by Media Filtration Collection Air & Water Waste Mgmt Purification Treatment Desalination Energy Recycling Renewable generation Energy storage Power distribution Supporting Technologies Sensing & Instruments Chemical processes New materials / Nano tech By Andrew Paterson
Project Drivers Change Investment View of Technology Business traits, market features, technology drivers change Investor orientations. Outside the U.S., project finance is the dominant model for environmental work. Predictable results are the key to mobilizing debt capital for leveraged profits. Technology applications must REDUCE uncertainty, rather than raise risk profile. Reducing regulatory and revenue uncertainty is a major factor in project completion. By Andrew Paterson
Project (Debt) Finance vs. Venture (Equity) Capital Project-finance model is another paradigm for viewing value of environmental innovation: not in the technology, but in application of technology to improve margins on specific projects with leveraged financing (debt and equity). Project finance is also the dominant model in energy and water sectors which drive environmental projects overseas. By Andrew Paterson
Finance and Environmental Technology What is the financial storyline relative to different environmental market segments ? Investors are driven by growth, and risk vs. return. [ Imagine your pension is being invested… ] By Andrew Paterson
Engineering: Global Demand Driving Margins Higher Global economic recovery and consolidation in the engineering sector has led to record backlogs for engineering firms with focus on rebuilding aging infrastructure domestically, and building new energy, water, and manufacturing facilities abroad. By Andrew Paterson
Big Oil: Healthier on Higher Prices, Demand in Asia Higher oil prices make big oil companies healthy. The majors – ExxonMobil, ChevronTexaco, BP, and COP – are all benefiting from massive consolidation in the sector and rising demand. By Andrew Paterson
Big Chemical: Profits Impacted by Higher Gas Prices The biggest makers –Dow, Dupont and Eastman – gained from prior consolidation in the sector and rising global demand; but sharply higher natural gas prices threaten margins. By Andrew Paterson
Remediation: Consolidation Leads to Some Recovery Numerous bankruptcies, headlined by IT Group, ICF-Kaiser and Molten Metal, later by engineering majors Foster Wheeler and Stone & Webster, have plagued a sector which reached over capacity in the mid-1990s and then struggled to adjust to declining margins. By Andrew Paterson
Waste Management: Cleaning Up the Balance Sheet Republic (RSG) is farther along in consolidating its financial position; whereas WMI and AW are still retiring debt or realigning after acquisitions. AW suffered margin erosion in 2004. By Andrew Paterson
Hazardous Waste: Consolidation completed Massive consolidation and bankruptcies of competitors have left the survivors with a solid business base and better margins; recycled materials prices rose to feed rising demand abroad. But, hazardous waste volumes are declining or are tied to economic growth. By Andrew Paterson
Instrument makers Register Positive Readings Thermo Fisher is a one time investor favorite, now consolidated. Becton Dickinson and Beckman Coulter show rising revenues and sound margins. By Andrew Paterson
Water Equipment & Chemicals Welling Up Nalco revenues ($3,600M) and profits are rising steadily, as with Ametek, ITT, and Pentair’s water group. Treatment standards and international sales are rising with demographic demand and economic growth to afford better water systems. GE owns US Filter now. By Andrew Paterson
Clean Energy Companies Powering Up Solar companies (Evergreen, First Solar) have soared as state RE measures pass and with the prospect of more congressional support with an “RE-friendly” bill. And, exports are robust. However, industrial giants GE, Kyocera, Sharp, BP, Siemens hold big market shares. By Andrew Paterson
Fuel Cell Companies Still Sputtering… on Fuel Costs. Fuel Cell Energy, Ballard Power, and Plug Power have not realized sales expectations and continue to show losses. All fuel cell systems have suffered from higher fuel (natural gas) costs. Market values collapsed like internet stocks. By Andrew Paterson
Conclusions: Take Home Message Market growth and policy clarity are vital for technology adoption. • Different market segments see different growth rates and demographic drivers; economics is key (vs. enforcement). • Growth prospects drive investment and adoption of innovation. • Project debt financing can be a useful model beyond venture capital equity financing for many environmental projects (e.g., water). • Financing is paramount for exports since overseas environmental markets are less developed. • EPA: can focus on missing links for Technology Implementation: Validation WITH stronger links to real projects, resolving policy conflicts, mechanisms for acceptance to improve predictability. • Verification of technology must involve training of regulators. • Federal agencies (like DOD, DOI) could play a role as a “first customer” for innovative approaches which could help resolve uncertainties related to revenues and regulatory acceptance. By Andrew Paterson
Finish: Web Site www.econergy.com www.ebiusa.com By Andrew Paterson
Back-up Slides & Remediation Module By Andrew Paterson
Appendix Remediation Markets: Major Points • Remediation Markets crested in the mid-1990s • Investigation has subsided in favor of remediation - though characterization, risk assessment are still important • DOE + DOD now comprise over half the market • Snapshot of “Established” DOE-EM markets - 85% of $6 billion annual budget spent on just 6 sites • Leading Contractors: well-consolidated now • Status of EM contracts / Site Budgets - “Them that already HAS, GETS” • Remediation: Opportunities & Threats By Andrew Paterson
Remediation Segments 1993 – 2002 Overall market remained flat throughout the 1990s; some growth now. Shares of DOE, DOD are growing. Superfund, state programs fading. Remediation market by customer segment Source: EBI By Andrew Paterson
Opportunities Some growth in risk analysis to reformulate treatment and closure criteria Voluntary cleanups, brownfields, property transfers, garnering “restorative value” Some small business set-asides provide openings Difficult cleanup challenges on unique waste streams require innovative approaches Regulators are more open to innovation and technology than in the past (via TIO, ITRC) Some new firms needed on special expertise Threats Little or no new legislation (RCRA, CERCLA, state rulings) DOE market is now entrenched with current contractors; difficult for new entrants to break in Continued dispute on “range rules” for DOD cleanups DOD cleanup spending is flat and faces cutbacks to support combat supply needs Remediation contractors remain risk averse in the main with slim base of capital to bear upsets Prior progress on cleanup inherently shrinks the market Loss / retirement of expertise with aging of vendor talent base Remediation: Opportunities & Threats By Andrew Paterson
EPA Budget and Agency Goals FY2004 & FY2008 The emphasis on air, clean water, land restoration echo market sizes. Budget by Agency Goal ($millions)FY04FY08 Clean Air & Climate Change $916 $912 Clean & Safe Water $2,960 $2,714 Land Preservation & Restoration $1,780 $1,663 Healthy Communities & Ecosystems $1,260 $1,172 Compliance & Stewardship $710 $744 TOTAL ($millions) $7,626 $7,200 Source: Environmental Business Journal By Andrew Paterson
Projected CO2 Emissions, 1990 – 2030 By Andrew Paterson
EPRI “Carbon Constrained” Scenario for Electricity EPRI used AEO 2007 as the reference, and then looked at what might be technically feasible by 2030. They are evaluating economics now to further review this “carbon constrained” case. EIA Base Case 2007 By Andrew Paterson * Achieving all targets is very aggressive, but potentially feasible.
“Risk Roundtable” Framework: Who Will Take Which Risks ? Policy Tradeoffs: Environmental goals Reliability Affordability The challenge to investors, owners, policy makers and consumers is to balance multiple policy goals. Evaluation of relative risks taken by public and private sector actors is important to move ahead. Science Who is bearing which risks… ? Investors Technology & Project Developers Fuel Providers Energy & Carbon Resources Utilities & Plant Owners Enviro Groups & NGOs Policy-makers Consumers education investment regulation & policy By Andrew Paterson resources