Click to edit Master text styles Second level Third level Fourth level Fifth level
220 likes | 249 Vues
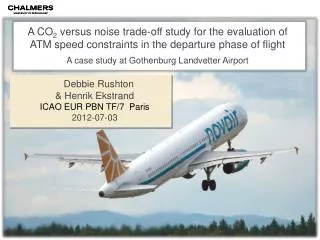
Investigating CO2 versus noise trade-off in the departure phase by analyzing speed constraints on TOPLA 1M SID at ESGG. Results show the impact on fuel consumption and noise levels, offering solutions for optimization.

Click to edit Master text styles Second level Third level Fourth level Fifth level
E N D
Presentation Transcript
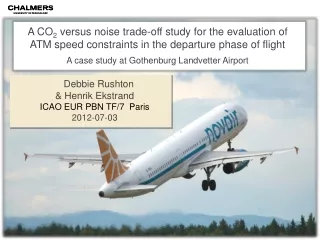
A CO2 versus noise trade-off study for the evaluation of ATM speed constraints in the departure phase of flight A case study at Gothenburg Landvetter Airport • Click to edit Master text styles • Second level • Third level • Fourth level • Fifth level Debbie Rushton & HenrikEkstrand ICAO EUR PBN TF/7 Paris 2012-07-03 1 1/1/2020
Outline • Motivation for study • Optimising local implementation of PANS-OPS guidance • Overview of turn-related speed constraints • Case study: Gothenburg Landvetter Airport • Speed constraints on TOPLA 1M SID • Speed constraint scenarios modelled • Data and aircraft performance/noise modelling • Results – CO2 versus noise trade-off study • Conclusions • Possible solutions for removal of SID speed constraints
Motivation SESAR target 10% CO2 via ATM improvements by 2020 Historically emphasis on reducing noise exposure around airports. Departure procedures based on interpretation of PANS-OPS Potential for substantial fuel savings Possibility for optimisation
Optimising local implementation of PANS-OPS guidance • Local interpretation and implementation of PANS-OPS guidance. • Procedure variation between airports (hence in environmental performance). • Some PANS-OPS procedures based on performance of old aircraft types (e.g. MD-80). • Modern state-of-art aircraft penalised increased CO2. • Identify solutions to optimise existing procedures based on aircraft performance whilst maintaining safety.
Example: turn-related speed constraints on departure • PANS-OPS recommends use of speed constraints on SIDs with small-radius turns at low altitude. • Designed to ensure containment within protection area during strong winds. • Speed constraint dependent on: • Track change of turn. • Altitude. • Assumed met conditions = worst-case tail wind. • Max. allowed aircraft bank angle = 25° above 3 000 ft. • Appears overly-conservative for modern aircraft, e.g. A321.
Fuel burn penalty of turn-related speed constraintsExample: 210 KIAS constraint at Gothenburg Landvetter Airport Flap retraction >210 KIAS for heavy aircraft Slat retraction usually >210 KIAS
Case study: Gothenburg Landvetter Airport (ESGG) RWY21 ESGG RWY03
TOPLA 1M departure route 210 KIAS speed constraint 210
Speed constraint scenarios 205 KIAS to 10 NM 210 KIAS to 10 NM 220 KIAS to 10 NM 250 KIAS to Flight Level 100 Free Speed (no constraints)
Data • Flight Data Recorder data from Novair. • Novair A321 departures along TOPLA 1M SID (RWY 03). • Take-Off Data Calculation (TODC) data. • Meteorological data. • Selected initial conditions for typical Winter flight.
Aircraft performance modelling & validation • Operational Flight Performance (OFP) tool in Airbus Performance Engineers Program (PEP). • Replicate actual flight performance based on manufacturer’s data. • Ensured PEP climb profile in good agreement with the FDR data. • Made deviations in PEP by changing speed constraints.
Aircraft noise modelling • Airbus Noise Level (NLC) tool. • Assume microphone location 1.2 m above ground level (ICAO Annex 16) and directly under flight path. • Noise calculations based on manufacturer’s Noise Power Distance tables. • Maximum A-Weighted Audible Noise (LAmax) metric used for analysis (metric used in Sweden for procedure development). Also describes single-event noise.
Speed Constraint Scenarios - Results • Climb profiles consistent until 5 NM and 2300 ft AGL. • 205 KIAS scenario has highest altitude between 5 NM and 12 NM. • 250 KIAS and Free Speed scenarios identical until 7 NM and 2800 ft AGL. • Free Speed profile has lowest climb angle during initial climb phase (limited due to prolonged acceleration phase).
Speed Constraint Scenarios - Results • Noise profiles identical until ~4NM. • Distances >7 NM Free Speed scenario generates highest LAmax. • Explained by shallow climb profile of aircraft. • Similar noise profiles for remaining 4 scenarios above 10 NM ground distance.
Speed Constraint Scenarios - Contours 210 KIAS to 10 NM (present day) Free Speed 70 dB(A) = 15 km2 70 dB(A) = 15 km2 55 dB(A) = 155 km2 55 dB(A) = 184 km2
Region affected by noise during prolonged acceleration phase Area most affected by increased noise due to removal of speed constraints
CO2 vs. Noise Trade-Off Analysis – Results • Potential for CO2 savings of ~180 kg per flight if remove 210 KIAS and 250 KIAS speed constraints on LABAN 1M SID (~60 kg fuel). • Increase in noise ranging between 2 dB(A) – 5 dB(A) during initial climb depending on position along flight path.
Speed Constraint Analysis - Conclusions • Removal of turn-related speed constraints increases noise closer in to airport but alleviates noise further out (objective of NADP 2). • Free Speed causes aircraft to stay closer to ground during initial climb – increase in noise profile by 2 – 5 dB(A) below 70 dB(A) depending on position along flight path. • Offset by potential fuel savings ~60 kg for heavy A321 winter flight and ~180 kg reduction in CO2. • ~3500 departures along TOPLA 1M per year ~190 tonnes of fuel savings and ~575 tonnes of CO2. • ATM industry must prioritise between aircraft noise exposure and CO2 emissionsin order to meet SESAR target of 10% reduction in CO2 emissions by 2020.
Possible solutions for removal of SID speed constraints Deviation from PANS-OPS & local safety case OR Optimise use of PANS-OPS guidance Use of statistical winds rather than worst-case winds for procedure design. Allow aircraft capable of banking 30° to fly turn without speed constraint. • Publish overlay SID procedure with less restrictive constraints. Publish RNP procedure using radius to fix (RF) legs. • Publish overlay SID procedure for RF-equipped aircraft. • Produces flight path that is almost identical to conventional one from ATC perspective – does not increase ATC workload or airspace complexity.
QUESTIONS? Email: deborah.rushton@chalmers.se henrik.ekstrand@novair.se