Footprinting DNA-Protein Interactions
270 likes | 1.56k Vues
Footprinting DNA-Protein Interactions. Powerful and fairly rapid methods for mapping where and how proteins bind tightly to DNA 2 ways: DNAse I footprinting DMS footprinting. DNAse I Footprinting. Prepare end-labeled DNA. Bind protein.

Footprinting DNA-Protein Interactions
E N D
Presentation Transcript
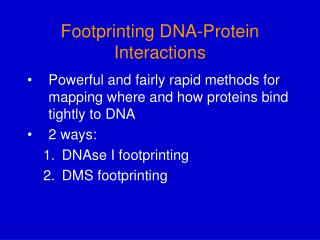
Footprinting DNA-Protein Interactions • Powerful and fairly rapid methods for mapping where and how proteins bind tightly to DNA • 2 ways: • DNAse I footprinting • DMS footprinting
DNAse I Footprinting • Prepare end-labeled DNA. • Bind protein. • Mild digestion with DNAse I (randomly cleaves DS DNA on each strand) • Separate DNA fragments on denaturing acrylamide gels. Fig. 5.37a
Fig. 5.37b Sample of a DNase I footprinting gel. Footprint Samples in lanes 2-4 had increasing amounts of the DNA-binding protein (lambda protein cII); lane 1 had none.
Dimethylsulfate (DMS) Footprinting • End-label DNA fragment. • Bind protein. • Treat with DMS, methylates purines. • Partially cleave DNA at the methylated bases. • Separate fragments on gel. Fig. 5.38a
Example of DMS footprinting. Lanes 1 and 4 had no protein Lanes 2 and 3 had 2 different amounts of protein. Protein binding protects most purines from modification by DMS, but it can stimulate modification of those in regions where the helix is distorted or partially melted (indicated by *) . Fig. 5.38b
Positive Control of Lac Operon • Catabolite Repression hypothesis • predicted that glucose would inhibit synthesis of other sugar metabolizing pathway enzymes (e.g., lactose pathway) • Partially right, its lack of activation instead of true repression • Cells respond to high glucose with lowered levels of cAMP and vice-versa • cAMP activates Lac operon via CAP
cyclic 5’-3’ phosphodiester incAMP glucose cAMP - Stimulates Lac operon (lacZ production) as the co-activator for the CAP protein CRP bends -->
CAP (catabolite activator protein), a.k.a. crp (cAMP receptor protein) gene • CAP only active bound to cAMP • CAP-cAMP stimulates transcription by promoting formation of closed complex: RNAP + Pro ↔ RPc → RPo (RPc = Closed complex) Kbk2(RPo = Open complex) Kb – equilibrium binding constant for formation of RPc k2 – rate constant for formation of RPo • CAP-cAMP increases Kb
Lac Control Region • CAP binds just upstream of promoter • L1 deletion mutant has constitutively low expression Fig. 7.16
CAP-cAMP dimer interacts with the CTD of the a subunits of the RNAP Core CAP-cAMP is a dimer that binds to a short sequence (~20 bp) with dyad symmetry (activator site) αCTD binds DNA too CTD - carboxy-terminal domain NTD - amino-terminal domain Fig. 7.19
CAP-cAMP-CTD and CAP-cAMP-DNA complexes:CAP-cAMP bends the activator DNA Fig 7.17
Why does the Lac Operon need an activator? Not a very good core promoter: -35 -10 TTTACAC ---------------- TATGTT (Lac) -35 -10 TTGACAT --------------- TATAAT (consensus) CAP stimulates more than 100 promoters!
Tryptophan operon: Regulation by attenuation • Genes for tryptophan synthesis • Repressed by end-product of pathway, Tryptophan • Repression requires Operator sequence, Aporepressor (trpR gene product) & Co- repressor (Tryptophan) - Operator is within the promoter • Also controlled by attenuation in the “Leader” region of the transcript
Low [tryptophan], aporepressor doesn’t bind Operator, transcription on! High [tryptophan], repressor (aporep. + tryp.) binds operator, represses transcription! Attenuation-->
Transcription stops in the leader-attenuator “L” region when the [tryptophan] is elevated.
The trp Leader peptide (14 aa) has two key tryptophan codons. The ribosome stalls at the trp codons when [tryptophan] is too low. The stalled ribosome prevents a downstream transcription terminator (IR + U-rich sequence) from forming. Fig. 7.31
Biological advantage: • Repression alone decreases expression 70-fold • Repression plus attenuation decreases expression 700-fold How is translation of the downstream genes achieved with the leader peptide there to stop the ribosomes?