Download
1 / 56
560 likes | 704 Vues
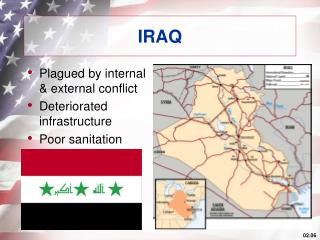
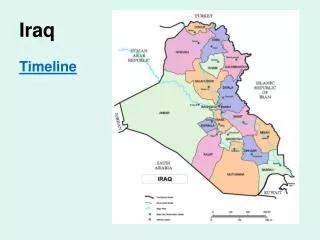
IRAQ Operationalizing Equity. Multidimensional Deprivation Analysis. MICS Analysis & Dissemination Workshop, Belgrade Nov 2011. IRAQ Mapping Child Well-being. D. a. h. u. k. N. i. n. e. w. a. E. r. b. i. l. K. i. r. k. u. k. A. l. S. u. l. a. y. m. a. n. i.

E N D
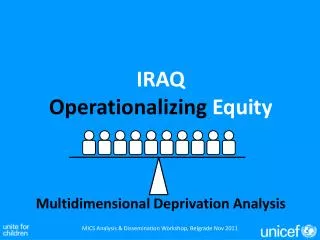
IRAQ Operationalizing Equity Multidimensional Deprivation Analysis MICS Analysis & Dissemination Workshop, Belgrade Nov 2011
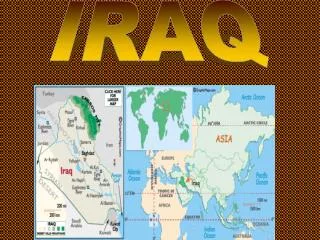
IRAQ Mapping Child Well-being D a h u k N i n e w a E r b i l K i r k u k A l S u l a y m a n i y a h S a l a h A d D i n D i y a l a B a g h d a d A l A n b a r W a s s i t K e r b a l a B a b i l A l Q a d i s s i y a M i s s a n N a j a f T h i - Q a r A l B a s r a h A l M u t h a n n a Life-Cycle Multidimensional Analysis UNICEF Iraq Country Office - December 2011
Purpose and Structure of Presentation Purpose: To present Iraq methodology and results for Equity Analysis using MICS4 2011 dataset. Structure: • Conceptual Framework • Quantitative Methodology • Overall Results • Profiles of Deprivation Groups • Patterns & Overlapping Deprivation • Proximity and geography of deprivations • Target achievement • Next Steps
Objectives of the Methodology • Build quantitative analysis on a clear conceptual framework founded on CRC, MDG, WFFC and Iraq’s context • Operationalise UNICEF´s global equity focus • Accurately identify the most deprived children (and their deprivation patterns) without ignoring less deprived ones • Obtain results easily understandable and communicable to stakeholders • Provides an equity-focused quantitative assessment for Iraq’s Situation Analysis (SitAn)
UNICEF Equity Focus • Human Development Report (HDR) 2010: The past 20 years have seen substantial progress in many aspects of human development and achievement of MDG targets. • However, these years have also seen extreme inequality in progress -both within and across countries- and this is identified as a powerful brake on accelerated progress towards the MDGs. • Definition of Child Equity: equal opportunities for all children to survive, develop and reach their full potential without discrimination, bias or favouritism. • Why Equity? • Right in Principle: moral imperative to respond to most disadvantaged and in-need children • Right in Logic: accelerates development towards attainment of national development targets • Right in Practice: Brings higher returns to investments in improving children’s lives
Iraq Equity Analysis Guiding Principles • Manifestations of Child Rights Violations: Deprivations faced by a child flag a violation of one or more of his/her rights. • Multiple Deprivations:Children face multiple deprivations, interconnected and often caused by common causes. “When sorrows come, they come not single spies. But in battalions”. • Life-cycle Stages: Children have different needs during the different stages of their lives – an infant requires different care than an adolescent. • Intra-stage and Inter-stage effect: The more deprivations a child faces, the worse the child’s situation will be both within a life-cycle stage and over stages • Spill-over effect: By reaching the most deprived children, the less deprived may be expected to benefit from an overall improvement in conditions. • International Standards & Context: selection and definition of dimension and deprivation thresholds through (1) CRC, MDG, WFFC (2) availability of data in MICS (3) critical issues at each stage of the child's life (4) adaptation to country context (Iraq)
Issue vsChild Centred Approaches IssueCentred Ahmed Manal Amina All ok (60%) 30% Deprived Out of School 1 Deprivation 30%) Manal Sahar 2 Deprivations (10%) 20% Deprived Child Labour ChildCentred Ahmed Manal Sahar Amina Out of School Child Labour
Child-Centred Approach • A Child-Centred Approach is concerned with multiple overlapping deprivations. • Instead of taking each indicator and measuring every relevant child; • take every child and measure him and her against every relevant indicator. X X X X X X X X X X X X X X X X
Child-Centred Approach: Equal Rights • What does a child-centred approach mean for Equity? No child has any deprivation!
Child-Centred Approach: 1 Indicator Out of School: All ok (80% of Population) • 2 children out of the 10 are out of school. 1 Deprivation (20%)
Child-Centred Approach: 2 Indicators Out of School: Child Labour: All ok (60% of Population) • 3 children out of the 10 are involved in child labour. 1 Deprivation (30%) 2 Deprivations (10%)
Child-Centred Approach: 3 Indicators Out of School: Child Labour: All ok (50% of Population) Violent Discipline: • 4 children out of the 10 suffer violent discipline. 1 Deprivation (20%) 2 Deprivations (20%) 3 Deprivations (10%)
Child-Centred Approach: 4 Indicators Out of School: Child Labour: All ok (50% of Population) Violent Discipline: • 3 children out of the 10 have unsafe water. Unsafe Water 1 Deprivation (20%) 3 Deprivations (20%) 4 Deprivations (10%)
Child-Centred Approach: 5 Indicators All ok (40% of Population) • 4 children out of the 10 don’t have improved sanitation. Out of School: 1 Deprivation (30%) Child Labour: Violent Discipline: 4 Deprivations (20%) 5 Deprivations (10%) Unsafe Water No Improved Sanitation
Child-Centred Measure of Inequity Worst 30% of all children Have 4 or more deprivations Middle 30% of all children Have only 1 deprivation Best off 40% of all children Have no deprivations All ok (40% of Population) 1 Deprivation (30%) 4 Deprivations (20%) 5 Deprivations (10%)
Children Life-Cycle Motherhood Birth & Early Childhood (0-59 mo) Maternal Care Child Marriage Late Adolescence (15-17 yr) Child Care Female Genital Mutilation Water Nutrition Access to Information Violent Discipline Schooling Sanitation Child Labour Schooling Access to Information Violent Discipline Middle Childhood (5-14 yr)
Children Life-Cycle(0-17 years) Motherhood Late Adolescence (15-17 yr) Birth & Early Childhood (0-59 mo) Maternal Care Child Marriage Female Genital Mutilation Child Care Shelter Access to Information Nutrition Violent Discipline Schooling Water & Sanitation Schooling Child Labour Access to Information Violent Discipline Middle Childhood (5-14 yr) UNICEF Iraq Country Office - December 2011
Birth & Early Childhood (0-59 months) Birth & Early Childhood (0-59 mo) Water Sanitation Maternal Care Child Care Nutrition Violent Discipline
Middle Childhood (5-14yr) Middle Childhood (5-14 yrs) Child Labour Schooling Access to Information Water Violent Discipline Sanitation
Late Adolescence (15-17 yrs) Late Adolescence (15-17 yr) Water Sanitation Child Marriage Female Genital Mutilation Access to Information Schooling
Household (0-17 yrs): Water & Sanitation Water & Sanitation (0-17 yr) Water Sanitation
ActualResults from MICS4 (All Children) All Children: 16.6 million children = 250,000 children 1.7 million (10%) All ok (No deprivations) 4.6 million (28%) Low (1 deprivation) 5.8 million (35%) Med (2 deprivations) 4.5 million (27%) High (3+ deprivations)
Proximity of Multiple Deprivation = 1 million children 38% Not Multi-Dep (6.3 m) 27% Multi-Dep (4.5 m) 35% Multi-Dep (5.8 m) 35% of all Households have no multiple deprived children 30% of all Households 35% of all Households