US Foreign Aid
US Foreign Aid. Submitted in partial fulfillment of Information Visualization MPS Degree Rob Rolleston 2013-12-14. Agenda. Developing and reasoning a data visualization design concept – A framework by Andy Kirk. 1. Establish the visualization's purpose and identify key factors.

US Foreign Aid
E N D
Presentation Transcript
US Foreign Aid Submitted in partial fulfillment of Information Visualization MPS Degree Rob Rolleston 2013-12-14
Agenda • Developing and reasoning a data visualization design concept – A framework by Andy Kirk 1. Establish the visualization's purpose and identify key factors 2. Acquire, prepare and explore your data 3. Establish editorial focus with your subject matter 4. Conceive your visualization design Data Representation, Color, Interactivity & Animation, Annotation, Arrangement 5. Construct your data visualization solution Rob Rolleston
(1) Establish the visualization's purpose and identify key factors Rob Rolleston
Purpose “This is your last chance. After this, there is no turning back. You take the blue pill – the story ends, you wake up in your bed and believe whatever you want to believe. You take the red pill – you stay in Wonderland, and I show you how deep the rabbit hole goes. Remember, all I'm offering is the truth – nothing more.” Morpheus to Neo, “the matrix” 1999 Rob Rolleston
MVIS 5003 Residency 3 One (1) Credit/Three and a half (3.5) daysDuring Residency 3, students present their final thesis project as detailed in the Information Visualization Project course description as well as a portfolio of work from the program that demonstrates an understanding of visualization and an ability to create a variety of thoughtfully-designed and compelling visual narratives. Rob Rolleston
MVIS 5003 Residency 3 One (1) Credit/Three and a half (3.5) daysDuring Residency 3, students present their final thesis project as detailed in the Information Visualization Project course description as well as a portfolio of work from the program that demonstrates an understanding of visualization and an ability to create a variety of thoughtfully-designed and compelling visual narratives. http://rob.rolleston.lunarpages.net/MICA/ Rob Rolleston
MVIS 5003 Residency 3 • Demonstrate Overall Mastery • End-to-End • Wear all 8 hats in the • Design is more important than Data & Analysis… for me • Complete Learning of new technology set in a web-based application • Animations • Connected components • filters, brushing, etc.. Rob Rolleston
Purpose • Goals • Intent = Tone + Function • Key factors • Source of initial idea Rob Rolleston
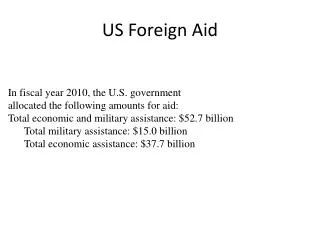
Project Goals • Help users understand the history of US Aid to Foreign Countries • Absolute amounts to each county • Relative amounts of Economic vs. Military Aid • 1946-2011 , inflation adjusted dollars • Learn about the changing aid to different Geographic Region(s) or Countries • See changes over time • Move through time to see the ebb and flow of the amount of aid provided to different regions or countries • Potential Uses • Teaching Aid • Interactive graphic to accompany a journalism article Rob Rolleston MICA InfoViz
Intent = Tone + Function • Present the data with an emphasis on precision and understanding • vs. feeling. • Allow the user to find their own insights • vs. presentation of key findings. Analytic / Pragmatic Tone Exploratory (Find Stories) Explanatory (Show Stories) Function Abstract / Emotive Rob Rolleston MICA InfoViz
Key Factors • The brief ? • Pressures ? • Audience size? • Audience type? • Setting? • Format? • Technical? • Subject matter? • Resolution? • Frequency? • Rules? • People? Open, self defined Due Dec-13th, Interim reviews in MVIZ 5701 & 5702 Wider world Already interested in the topic, desire to learn more Remote, independent access Interactive Singe Web page; HTML5/CSS3/JavaScript Broad sweep across time, geographies, and amounts Hierarchy of Countries within Regions; Single Year One-off Landing page + at least 2 working interactive elements Individual; Wear all 8 hats… Rob Rolleston
Birth of an Idea • MVIS 5501 Principles of visual Interface Design (May/June 2013): • Choose a manageably sized data set on a topic of interest and design an interface to display and interact with the data in a way that helps explain it.Document this design as series of wireframes with a similar level of fidelity as those from the last assignment. http://ejfox.github.io/GoodData/ Rob Rolleston
Initial Concept Rob Rolleston
Iterations… Rob Rolleston
Interactions Rob Rolleston
Iterations… Rob Rolleston
Iterations… Rob Rolleston
Inspiration and More Iteration http://www.ted.com/talks/hans_rosling_shows_the_best_stats_you_ve_ever_seen.html http://bost.ocks.org/mike/nations/ Rob Rolleston
(2) Acquire, prepare and explore your data Rob Rolleston
Acquisition, Exploration, and Preparation https://explore.data.gov/Foreign-Commerce-and-Aid/U-S-Overseas-Loans-and-Grants-Greenbook-/5gah-bvex • Exploratory in Spotfire • Proof that stories exist Year (1946-2011) 204 Countries • Combine to single source • Tag Economic & Military • Add Regions • Convert to JS Object Source: data.gov/Foreign-Commerce-and-Aid • JS Calculations • Total, Ratio, Visibility, … Rob Rolleston MICA InfoViz
Data: Acquisition • 2 excel sheets, each with Aid to country by year • Military Aid • Economic Aid (with sub-projects) • “ These data are U.S economic and military assistance by country from 1946 to 2011. This is the authoritative data set of U.S. foreign assistance. The data set is used to report U.S foreign assistance to Congress as required by the Foreign Assistance Act, Section 634” • Physicality • Amounts in Constant Dollars (2011) [not using absolute Dollars] • Data type: Tabular – Ordered – Quantitative • (200 countries) X (66 yrs.) X (2 types)→~27,00 data points Rob Rolleston
Data : Prepare • Consolidate econ projects • Excel: ‘consolidate’ function Sum Projects to Country Total • Join • Single sheet with both military & economic aid Rob Rolleston
Data: Explore • Convert from ‘wide’ to ‘’long’ • “R” reshape2 library Allows for “Year” to be Treated as an attribute and used as a filter • Explore • “Spotfire” • Summary Statistics • Histograms Rob Rolleston
Data Summary Economic (n=7722) Log10 scale More economic than military aid, in both numbers and amounts with large ranges Military (n=5212) Log10 scale Rob Rolleston
Calculated Data : Total & Ratio Total (n=8323) Log10 scale Most aid is 100% Economic (4732) with some Military A few (688) have pure Military Aid Ratio of Economic to Military (n=8315) 100% Economic 100% Military Rob Rolleston
Data: Explore Rob Rolleston
Data: Explore Challenge: Too many countries for color or shapes 1946 1958 1984 2011 Rob Rolleston
Data : Enhance http://www.who.int/quantifying_ehimpacts/global/ebdcountgroup/en/ • Group Countries by “Region” • Finer granularity than “Continent” • Better indicator or socio-political affiliations • e.g. Eastern vs. Western Europe http://www.nationsonline.org/oneworld/countries_of_the_world.htm#top http://www.scientificamerican.com/article.cfm?id=babys-life-mothers-schooling Rob Rolleston
Data: Add Region Attribute • Original list had 237 Countries in 55 regions • Join with 204 countries • Reduce to 16 Regions • Later reduced to 13 Rob Rolleston
(3) Establish editorial focus with your subject matter Rob Rolleston
Editorial Focus • Exploratory Analysis to find insights Eastern and Western Europe 2000 1946 Rob Rolleston
Editorial Focus: Audience / Story • Students of history, economics, political science Text from User Testing: Imagine you are a student in a class about US History or Foreign Relations, Economics etc. Or you have just read an article in a newspaper like the New York Times, or a national magazine like Time, Newsweek, or The Atlantic. Perhaps the Visualization is an interactive web page which the professor has referenced, or is referenced in your text or accompanies the article you have just read. It is assumed you have some knowledge of 20th century global history, and how the political and economic alliances of the US have changed over time. You are interested in learning more about the ebb and flow of aid over time across geographies. Rob Rolleston
Editorial Challenge • Help user to find stories in 27,000 data points • Geography • Countries (204) • Regions (12) • Time • Covers years 1946-2011 • Types of Aid • Economic & Military • Interactive visualization • “Overview, zoom & filter, details-on-demand” • http://mi2.org/resources/data-visualization-ben-schneiderman.pdf Rob Rolleston
(4) Conceive your visualization design Data Representation Color Interactivity and Animation Annotation Arrangement Rob Rolleston
(4) Conceive your visualization design Data Representation Rob Rolleston
Data Representation Data Attributes • Amount of Aid • Economic • Military • Mixture of Aid • Econ vs. Milit • Year • Given Year • Changes over Time • Geopolitical Regions • Region / Country Mark Attributes • Visibility • Spatial Location • X • Y • Size • Color • Opacity, Stroke • Tooltip / Annotation • Motion ? Rob Rolleston
(4) Conceive your visualization design Color Rob Rolleston
Color • Tone: Analytic/Pragmatic • Overall Neutral Color them • Show Common Grouping • Countries within Regions • ~12 Categorical Colors • Interaction affordability • Hover state “Avoiding catastrophe becomes the first principle in bringing color to information: Above all, do no harm.” — Envisioning Information, Edward Tufte, Graphics Press, 1990 “Get it right in black and white.” — Maureen stone et. al. http://colorbrewer2.org/ https://github.com/mbostock/d3/wiki/Ordinal-Scales Rob Rolleston
(4) Conceive your visualization design Interactivity & Animation Rob Rolleston
Interaction Selection / Filter Information Introductory Information Show / Hide County Names On/off checkbox Tooltips Aid details for a country About Technical details & Credits Author • Total Time Scale Overview • Total Funding for each year • Stacked Line Chart • “Pick” a year to view • Regions / Countries Filter • Three State tree check boxes Rob Rolleston
Animation • Changes over timee.g. x-y position of country • Manual • Click • Pick a year • Slide / Drag • Move through years • Increment / Decrement • Single Step • Automatic • Play, auto step thru time • Forward / Backward Total Funding Total Funding Total Funding Year 1 Funding Mix Funding Mix Funding Mix Year 2 Year 3 Rob Rolleston
(4) Conceive your visualization design Annotation Rob Rolleston
Annotation Information Reference Minor, inconspicuous elements Text links in footer About Modal Pop up Who, What, When, Why, How Author Link to other work • Information Box • Expander • Keep above the fold • Collapse to focus on data • Legend • Aid to understanding • Color & Size • Authentication of data • Labels • Axis Labels • Current Year • Large background element in main chart Rob Rolleston
(4) Conceive your visualization design Arrangement Rob Rolleston
Arrangement: Major Elements • Header • Title • Information Box • Section • Scatter Chart • Time Selection • Region / Country filter • Legend • Footer • Author & About Authoritative Collapsible Closely Aligned Near Slightly apart Minor Rob Rolleston
Arrangement: Iterative Process • Initial HTML Skeleton • Header, Section, Footer • Components; simple HTML + JavaScript + CSS • Scatter Chart: Bubble Chart • Time Selection: Stacked Area + Brush • Region / Country Filter: Tree Check Boxes • Integration of components into HTML Skeleton • User Testing • InfoViz Cohort & Naïve Users Rob Rolleston
(5) Construct your data visualization solution Rob Rolleston
Technology • Data Gathering & Cleaning • Excel • Proof of Concept • TIBCO Spotfire • Interactive Web Site: HTML5, CSS3, JavaScript • Structure / Layout: Bootstrap • Easy to use grid structure • Data Display & Interaction • D3.js, jQuery • Selection / Filtering • jQWidgets Rob Rolleston MICA InfoViz
Construction + + + + + Structure Scatter Plot Slider& Chart Integration Filter Annotation 204 Circles Color = function{region } Size = function{yrs of aid } Location = function { total, mix } Visibility = function { amount != 0 in year, region/country filter} Filter Countries Select Year Rob Rolleston
Demo Rob Rolleston