
SPSS Tutorial: Data Analysis Demonstration for Beginners
E N D
Presentation Transcript
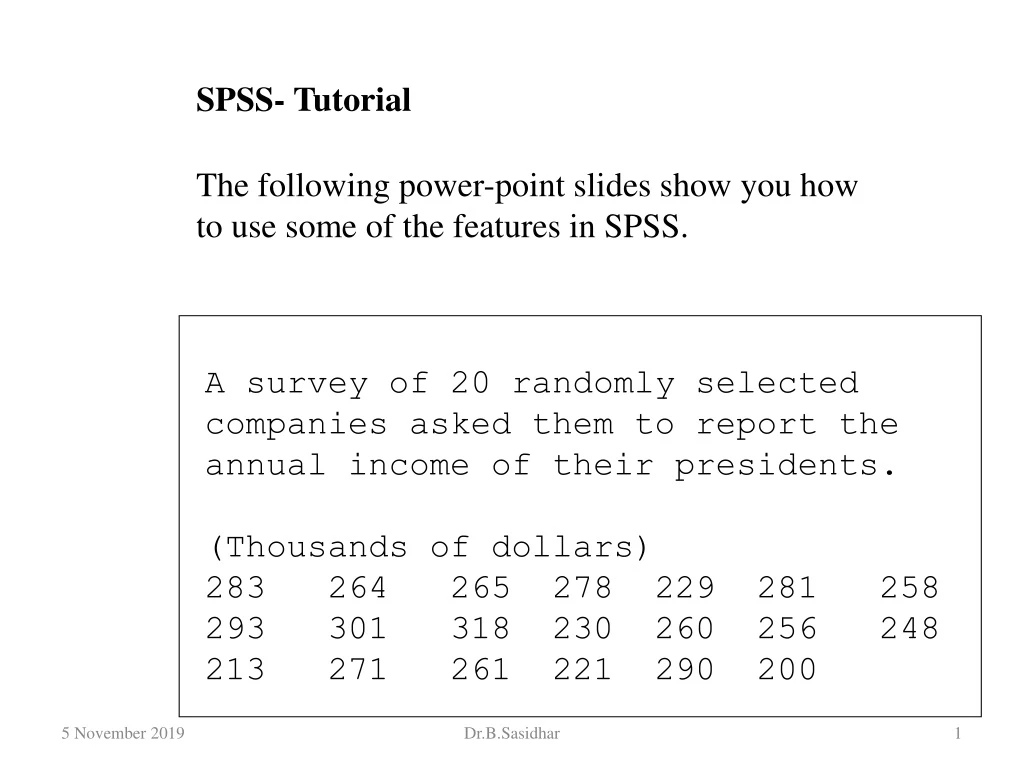
SPSS- Tutorial The following power-point slides show you how to use some of the features in SPSS. A survey of 20 randomly selected companies asked them to report the annual income of their presidents. (Thousands of dollars) 283 264 265 278 229 281 258 293 301 318 230 260 256 248 213 271 261 221 290 200 Dr.B.Sasidhar
You can start SPSS for Windows using either of the following ways: (1) If you already have the SPSS icon on your desktop, double click on the SPSS icon. OR (2) Go to Start Menu | Programs | SPSS 16.0 for Windows. Dr.B.Sasidhar
When you open the SPSS, this window will appear. If it is the first time you are key-in the data, click type in data Dr.B.Sasidhar
Menus Available in the Data Editor Window File: To open an existing file, to read data (from a text data file or from an application [like Excel] data file) into Data Editor window, to save a data file, and to exit SPSS for Windows. Edit: To make changes like copy, cut or paste to the Data Editor window. These functions work just like a spreadsheet. View: To view status bar, tool bar, variables. Data: To define variables, insert variables or cases, sort cases, merge files, split files, select cases and use a variable to weight cases. Transform: To do some computations on variables, to create new variables from existing ones or recode old variables. Dr.B.Sasidhar
Menus Available in the Data Editor Window (Contd.) Analyze: To do statistical analysis, from descriptive statistics to testing of hypothesis. Graphs: To obtain various plots and graphs. Utilities: To run script and to display information on the contents of SPSS data files. Add-ons: To provide on-line help and statistics guide for advanced topics and also to provide related information from the SPSS website. Window: To move to an open window or to see which window is active. The window with a check mark is the active one. Help: To get help on topics in SPSS and to ask the statistics coach some questions. This is a very useful tool. Dr.B.Sasidhar
Then, this window will appear. Please go to variable view. This will introduce the SPSS program the type of data you have. ( quantitative or qualitative …….) Dr.B.Sasidhar
Type in the relevant information. In our case, the name: I have typed in ‘salary’ as an example. The next important column is Variable type because this is where you identify the data quantitative or qualitative. Dr.B.Sasidhar
The last column is also very important because you know that we have diff. level of numerical fig. In our case, we chose the highest order. Dr.B.Sasidhar
Then go to Data View and key-in the data - the salaries of the presidents. Dr.B.Sasidhar
After that, you can proceed to analysis of the data. If you want to describe the data you can go to analyze or show in graphical form Dr.B.Sasidhar
For graph Dr.B.Sasidhar
If you want to get the descriptive information, click the analyze button, a drop down menu appear, please click descriptive statistics, and then click descriptives. Dr.B.Sasidhar
The descriptives will appear and the variables will be shown in the box on the left side. In our case we only have one variable that is salary. Dr.B.Sasidhar
Then transfer the salary to the box on the right (variable(s)). Highlight the salary by click on it and in the middle of these two boxes is a direction button, please click on it and the salary will appear in the right side. Dr.B.Sasidhar
Please click the option button, to identify the type of description you like for example mean, std.deviation etc. After you make the selection please click continue. Finally click OK. Dr.B.Sasidhar
Then the result will appear. Dr.B.Sasidhar
To go back to the data click this button Dr.B.Sasidhar
If you want to present the data collected in graphical form please click Graphs and then choose the required graph. I have chosen boxplot ( simple, summaries of separate variables and then also click define ) Dr.B.Sasidhar
The procedure is the same as descriptive, you have to choose the appropriate variable and click OK. Dr.B.Sasidhar
The end Dr.B.Sasidhar