
Hydro-Climatological Connections Between Amazon and La Plata River Basins: A 19-Year Study
This study explores the hydro-climatological link between the Amazon and La Plata River basins through backward and forward trajectory analyses. Over a 19-year period (1979-1998), we quantified the contributions of evaporative moisture from the Amazon to precipitation in the La Plata basin. Our findings indicate that local recycled precipitation represents 32% of annual precipitation in La Plata, while the Amazon contributes 19%. The study highlights the importance of these basins' interactions on a continental scale, focusing on seasonal variations and transport mechanisms.

Hydro-Climatological Connections Between Amazon and La Plata River Basins: A 19-Year Study
E N D
Presentation Transcript
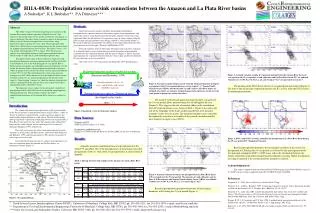
TRNA TRNA TRNA TRNA A A A A LP LP LP LP Backward trajectory analysis (backward in time) (Dirmeyer and Brubaker, 1999) ET P through solutions of eq.s of mass, momentum, and energy (NCEP reanalyses) Forward trajectory analysis (forward in time) (developed in this study) t time ( ) H11A-0830: Precipitation source/sink connections between the Amazon and La Plata River basinsA Sudradjat*, K L Brubaker**, P A Dirmeyer*** Methods Backward-trajectory analysis identifies and quantifies probabilistic contributions of evaporative moisture from source regions to precipitation in a sink region. The analysis tracks backward in time the paths of parcels of air from a sink region and tallies the contributions of evaporation events in source regions along the paths starting from precipitation events during a pentad (a 5-day period) (Figure 2). The analysis identifies and quantifies the sources of all evaporated moisture that falls as precipitation in a sink region. (Dirmeyer and Brubaker, 1999). Forward-trajectory analysis (FT) tracks forward in time trajectories of parcels of air launched from a source region during a pentad to locations of precipitation contributed by the evaporated moisture from the parcels (Figure 2). Hence, locations of precipitation for evaporated moisture from the source regioncan then be identified. The precipitation can also be quantified. This study covers a 19-year period, from September 1979 through August 1998. Abstract This study examines the hydro-climatological connection of the Amazon River basin with the adjacent La Plata River basin. The Amazon is the world’s largest river, and the La Plata the sixth largest, in terms of discharge. The most recent evaporative sources of precipitation falling in the two basins are mapped on a seasonal basis, using backward-trajectory analysis for water vapor. The precipitation sinks within the La Plata basin of evaporated moisture from the Amazon basin are mapped using forward-trajectory analysis. The analysis covers a 19-year period, from September 1979 to August 1998. The trajectory analysis uses atmospheric dynamics and evapotranspiration from the NCEP reanalyses and COLA's global hybrid precipitation data. Precipitated water vapor of local evaporative origin (recycled precipitation) dominates annual precipitation in the La Plata basin with a contribution of 32% of the total during the 19-year period. Due to South American orography and atmospheric general circulation over the region, the Amazon basin is the most important non-local evaporative source of precipitation in the La Plata basin, with an annual contribution of about 19% of total. The controlling factors of the mean moisture transport over the La Plata and the fact that the Tropical Atlantic Ocean contributes about 32% of annual precipitation in the Amazon basin suggest a "leap-frogging" transport, in which the moisture from upwind sources is precipitated in the Amazon basin, then evaporated to fall as precipitation in the La Plata River basin. The important source regions for the interannual variability of precipitation in the La Plata River basin are identified using Empirical Orthogonal Functions. These findings reinforce the hydro-climatological importance of the Amazon River basin on a continental scale. DJF MAM DJF MAM EQ EQ EQ EQ JJA SON EQ EQ JJA SON EQ EQ Figure 5. Seasonal variation of sinks of evaporated moisture from the Amazon River basin (A) averaged over the 19-year period. A (and subbasins) and La Plata River basin (LP) are outlined. Contours are at 0.05, 0.2, 0.4, 0.8, 1.2, 2.4, and 3.6 kg m-2 day-1 (or equivalent to mm day-1). Figure 3. Seasonal variation of the mean of vertically integrated moisture transport averaged over the 19-year period shown as vectors in kg m-1 s-1. Tropical North Atlantic Ocean (TRNA) and the Amazon (A) and La Plata (LP) River basins are outlined. Also shown are contours of annual mean surface pressure, in mb, over the same period as proxies for surface elevations. The position of the ITCZ directs the fate of evaporated moisture from A (Figure 4). The lowest sink of Amazon-evaporated moisture in LP is in JJA, when the ITCZ reaches its northernmost position. The mean of vertically integrated moisture transport averaged over the 19-year period allows moisture from A to LP throughout the year (Figure 3). This suggests the role of transient eddies in the contribution from LP to precipitation in A as shown in Table 1. Figure 3 also shows the role of the orography of the Andes in directing the low-level moisture transport vectors over the region. The moisture transport varies seasonally throughout the year due to seasonality of the general circulation and the inter-tropical covergence zone (ITCZ). EOF-1 (EV= 26%) EOF-2 (EV= 11%) Introduction The amount and timing of precipitation in a sink region depends on the fate of moisture evaporated from source regions. Hence, a study on the fate of moisture evaporated from a source region may improve the understanding of precipitation in a sink region. The lack of knowledge about precipitation-evaporation relationships between the Amazon and La Plata River basinsmotivates this study. The Amazon and La Plata River basins arethe world’s largest and the sixth largest river in terms of discharge (Dingman, 1994), respectively. This study investigates the source-sink connections between the Amazon (A) and La Plata (LP)River basins. Backward- (BT) (Dirmeyer and Brubaker, 1999) and forward-trajectory (FT) analyses for parcels of water vapor are used as tools. Ocean and land regions that may be sources of precipitation to, or sinks of evaporation from, the Amazon and La Plata basins, are delineated as shown (Figure 1). EQ EQ Figure 2. Backward v. forward trajectory analyses. Data Sources Dynamics and ET: NCEP reanalyses (Kalnay et al. 1996). Precipitation (gridded-observed): Higgins et al. (1996) for M and Dirmeyer and Tan (2001) for the rest of the domain. DJF MAM EQ EQ Results Figure 6. EOF-1 and EOF-2 of source anomalies for precipitation in La Plata River basin during the 19-year period (EV = Explained Variance) Annually, moisture contribution from A to precipitation in LP is about 19% and about 32% of the precipitation is of local origin (recycled precipitation) (Table 1). Only about 2% precipitation in A comes from LP annually. Recycled precipitation dominates the interannual variability of the sources for precipitation to LP during the 19-year period, as reflected by the spatial pattern of the first principal component (EOF-1). EOF-2 may reflect the relationship between the Andes’ redirection of moisture transport and precipitation recycling. Higher precipitation recycling is expected if the external moisture transport is reduced. JJA SON EQ EQ Table 1. The top 10 source/sink regions for the Amazon (A) and La Plata River basins. Acknowledgements This study is supported under the NOAA/NASA GCIP Program Grant NA96-GP0268. Access to the NCEP reanalyses data is supported under the NCAR/SCD Grant 35161040. Figure 4. Seasonal variation of sources for precipitation in La Plata River basin (LP) averaged over the 19-year period. The Amazon (A) (and subbasins) and La Plata (LP) River basins and Tropical North Atlantic Ocean (TRNA) are outlined. Contours are at 0.05, 0.2, 0.4, 0.8, 1.2, 2.4, and 3.6 kg m-2 day-1. References Dingman, S. L., 1994: Physical Hydrology. Prentice Hall, 575 pp. Dirmeyer, P. A., and K. L. Brubaker, 1999: Contrasting evaporative moisture sources during the drought of 1988 and the flood of 1993, J. Geophys. Res., 104, D16, 19,383-19,397. Dirmeyer, P. A., and L. Tan, 2001: A multi-decadal global land-surface data set of state variables and fluxes. COLA Technical Report 102 [Available from the Center for Ocean-Land-Atmosphere Studies, 4041 Powder Mill Road, Suite 302, Calverton, MD 20705 USA], 43 pp. Higgins, R. W., J. E. Janowiak, and Y. P. Yao, 1996: A gridded hourly precipitation database for the United States. ATLAS 1, NCEP/Clim. Predict. Cent., Camp Springs, Md., 47 pp. Kalnay, E., et al., 1996: The NCEP/NCAR 40-year reanalysis project, Bull. Am. Meteorol. Soc., 77, 437-471. Recycled precipitation (precipitated moisture of local origin) dominates in LP during the 19-year period (Figure 4). Figure 1. The spatial domain. * Earth System Science Interdisciplinary Center (ESSIC), University of Maryland, College Park, MD 20742; ph. 301-405-9211; fax 301-314-1876; e-mail: arief@essic.umd.edu ** Department of Civil and Environmental Engineering, University of Maryland, College Park, MD 20742; ph. 301-405-1965; fax 301-405-2585; e-mail: klbrubak@eng.umd.edu ***Center for Ocean-Land-Atmosphere Studies, Calverton, MD 20705-3106; ph. 301-902-1254; fax 301-595-9793; e-mail: dirmeyer@cola.iges.org


