Download
1 / 66
670 likes | 893 Vues
Human Population : Growth, Demography and Carrying Capacity Chapter 11 Miller 11th Edition. AP Environmental Science LCHS Dr. E. Human Population Growth Historically. Early Hunter Gatherers Nomadic, With a Strong Sense of the Earth Practiced Intentional Birth Control Rise of Agriculture

E N D
Human Population:Growth, Demography and Carrying Capacity Chapter 11Miller 11th Edition AP Environmental Science LCHS Dr. E
Human Population Growth Historically • Early Hunter Gatherers • Nomadic, With a Strong Sense of the Earth • Practiced Intentional Birth Control • Rise of Agriculture • Necessary for Survival
C. Agriculture Gives Rise to Cities • Food Produced in Country, Consumed in City • Food wastes are no longer returned to soil • Soil becomes less productive • Waste of Populations Concentrated in Cities • Population Control in Medieval Societies • Infanticide (Dysentery) • Plagues
D. Industrialization • View of Children During Early Phases of Industrial Growth • Served a functional role in family • Exponential growth of populations • By 1900s, Birth Rate in Industrialized World Dropped • Rise in standards of living • Safe and inexpensive means of birth control introduced • Increase in the cost of child rearing
MI L L I O NS
Population Projections Over 95% of this increase will take place in “Developing Countries”
Current World Population • Population ClockVital Events (per time unit) Global population was 6,089,648,784 June 2000 • The global population grows by: • Nearly 2.4persons per seconds • Nearly 8,726 persons per hour • Over 209,416 persons per day • Over 76.5 million persons per year
How Much is a Billion? • 1,000 seconds = 16.7 minutes • 1 million-s = 16,677 min = 11.6 days • 1 billion-s = 11,574 days = 31.7 years • 1,000 pennies = ~ 88 ounces = 5.5 pounds • 1 million pennies = 5,500 pounds (~1-Suburban) • 1 billion pennies = 2,750 tons (~2 Space Shuttles)
Human Population Outline • Factors Affecting Human Population Size • Population Age Structure • Influencing Population Size • Carrying Capacity
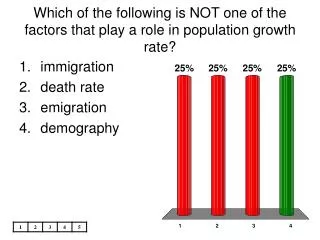
Human Population Dynamics • There are just three sources of change in population size — • fertility • mortality • "natural decrease" refers to population decline resulting from more deaths than births • migration • Net migration is the number of immigrants minus emigrants
Rates of Global Pop. Changeuse: International Data Base http://www.census.gov/ipc/www/idbnew.html, then Online Demographic Aggregation • CBR (crude birth rate) = # births / 1000 population 1990: 24 now: 20.6 • CDR (crude death rate) = # deaths / 1000 population 1990: 9 now: 8.8 • Growth Rate = (b + i) – (d + e) 1990: 1.5% now: 1.19% • growth rates have come down
Human Population Dynamics • Total fertility rate (TFR) • The average number of children born to a woman • Average in developed countries = 1.5 • Average in developing countries = 3.8 • Worldwide 1990: 3.1 now: 2.76 • Replacement fertility rate (RFR) • The number of children a couple must have to replace themselves • A TFR of 2.1 for developed countries with low infant and child mortality rates • Africa RFR = 2.5
Human Population Dynamics • infant mortality rate • IMR • infant deaths per 1000 live births (infant < 1 yr) • 1990: 62 now: 52.4 (normal in 1900: 200)
http://www.povertymap.net/pub/mipwa/sections/w-global/health-sanit/infant-mortality-2.htmhttp://www.povertymap.net/pub/mipwa/sections/w-global/health-sanit/infant-mortality-2.htm
Maternal Deaths per 100,000 Live Births Source: WHO, UNICEF, UNFPA Maternal Mortality in 1995: Estimates Developed by WHO, UNICEF AND UNFPA, 2001.
Migration Net migration is the number of immigrants minus emigrants
Overall, the world population is growing at a rate of about 1.7 per cent; if this rate continues, the population will double in 42 years. • Unabated, such a rate would lead to a point about 2000 years hence when the mass of humanity would weigh more, and be larger, than the Earth. • But, the growth rate is decreasing
Human Population Outline • Factors Affecting Human Population Size • Population Age Structure • Influencing Population Size • Carrying Capacity
Population Pyramids • Graphic device: bar graph • shows the age and gender composition of a region • horizontal axis: gender • male: left-hand female: right-hand • absolute number of people or % • vertical axis: age • 5-year or 10-year age groups
Population Pyramids • Population Pyramids on the Web • High Growth: Afghanistan • Moderate Growth: Mexico • Zero Growth: U.S. • Negative Growth: Austria or Italy
Population Pyramids • Population Pyramids on the Web • High Growth: Afghanistan • Moderate Growth: Mexico • Zero Growth: U.S. • Negative Growth: Austria or Italy
Population Pyramids • Population Pyramids on the Web • High Growth: Afghanistan • Moderate Growth: Mexico • Zero Growth: U.S. • Negative Growth: Austria or Italy
Population Pyramids • Population Pyramids on the Web • High Growth: Afghanistan • Moderate Growth: Mexico • Zero Growth: U.S. • Negative Growth: Italy
Demographic Transition • Movement of a nation from high population growth to low population as it develops economically • Transition as a result of four stages • Stage 1—Birth and death rates are both high • Stage 2—Death rates fall; birth rates remain high; growth rate rises • Stage 3—Birth rates fall as standard of living rises; growth rate falls • Stage 4—Growth rate continues to fall to zero or to a negative rate
Five Stages of the Demographic Transition • Used to be 4, now 5 stages • birth rates, death rates and growth rates systematically change through time as societies change: • modernize, urbanize • gain access to technology
Population Pyramids and Demographic Stages • characteristics shapes of ‘pyramids’ • wide base (true pyramid) • wide middle (bulge), somewhat wider base • urn- or bottle-shaped • reversed pyramid • different shapes--different dynamics
Stage 1 • high birth rates, high (at time erratic) death rates, low growth rates • stage for much of human history, traditional societies • practically no country today
Stage 2 • high birth rates, declining death rates, rising growth rates • improvements in sanitation (water) and medicine • in Europe during Industrial Revolution • in developing countries since the 50s/60s • much of Africa today, some countries of Asia (Afghanistan, Nepal, etc.)
Population Pyramid and Demographic Transition • Stage 2: wide base • stage 3: wide middle • stage 4: slender • stage 5: narrow base
Stage 3 • continued decline of death rates, declining birth rates, growth rates decline from high to lower levels • change in behavior: adaptation to lower death rate, in particular infant mortality rate • economic change: urbanization (incentive to have fewer children) • Mexico today
Population Pyramid and Demographic Transition • Stage 2: wide base • stage 3: wide middle • stage 4: slender • stage 5: narrow base
Stage 4 & 5 • Stage 4: low birth rates, low death rates, low growth rates • United States today • Stage 5: low birth rates, rising death rates, declining growth rates (if birth rates drop below death rates: negative growth rates) • several countries of Europe today (Austria)
Population Pyramid and Demographic Transition • Stage 2: wide base • stage 3: wide middle • stage 4: slender • stage 5: narrow base
Population Pyramid and Demographic Transition • Stage 2: wide base • stage 3: wide middle • stage 4: slender • stage 5: narrow base
Demographic Trap • Population Path of Most Less-Developed Countries (LDCs) • “Trapped” in Stage 2 of Demographic Transition • Before 1970, LDCs seemed poised to make transition thanks to economic growth • Since 1970, economic growth has not kept pace with population • High birth and low death rates result in explosive population growth • Downward spiral in standard of living