Download
1 / 17
170 likes | 284 Vues
3.2. Graphs to show the effects of Inhibitors on Enzyme Action. Rate of reaction. 1. Substrate concentration. Forward. Explanation. 2. Rate of reaction. 1. Substrate concentration. Forward. Every active site is saturated. The rate of the reaction is at its highest. Close.

E N D
3.2 Graphs to show the effects of Inhibitors on Enzyme Action
Rate of reaction 1 Substrate concentration
Forward Explanation
2 Rate of reaction 1 Substrate concentration
Forward Every active site is saturated. The rate of the reaction is at its highest. Close Explanation
3 2 Rate of reaction 1 Substrate concentration
Forward Every active site is saturated, so there is no increase in the rate of reaction. Close Example
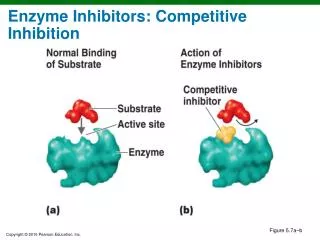
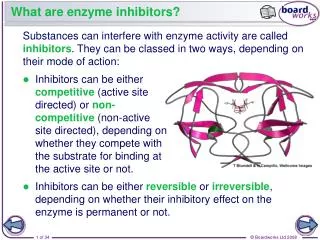
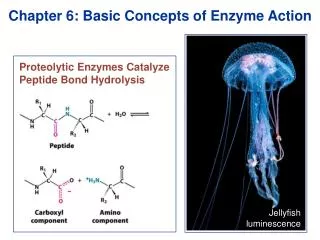
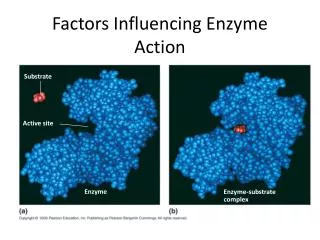
Enzyme Inhibitors: Inhibition occurs when enzyme action is slowed down or stopped by another substance. The inhibitor combines with the enzyme and stops it forming an enzyme-substrate complex. • There are two types of inhibitor: • COMPETITIVE INHIBITOR • NON-COMPETITIVE INHIBITOR
Competitive Inhibitors: • The inhibitor is structurally similar to the substrate and competes with the active site for the enzyme. • I.e. the inhibitor has a shape that lets it fit into the active site of the enzyme in place of the substrate. For example, malonic acid competes with succinate for the active sites of succinic dehydrogenase, an important enzyme in the Krebs cycle in respiration. • If the substrate concentration is increased it will reduce the effect of the inhibitor. • This is because the more substrate molecules present the greater the chance of finding active sites, leaving fewer to be occupied by the inhibitor.
Non-Competitive Inhibitors: These inhibitors bind to the enzyme at a site away from the active site. This alters the overall shape of the enzyme molecule, including the active site, in such a way that the active site can no longer accommodate the substrate. • As the substrate and inhibitor molecules attach to different parts of the enzyme they are not competing for the same sites. • The rate of reaction is therefore unaffected by substrate concentration. For example, cyanide (a respiratory poison) attached itself to part of the enzyme, cytochrome oxidase, and inhibits respiration.
Competitive Inhibitor Revise 3 2 Rate of reaction 1 Substrate concentration
Non-competitive Inhibitor Revise 2 Rate of reaction 1 Substrate concentration
Forward A competitive inhibitor binds to the enzyme’s active site, and slows down the process. Close Explanation
Forward The substrate will soon find an active site. The effect of a competitive inhibitor is to slow down the process. Close Explanation
Revise 2 Rate of reaction 1 Substrate concentration
Forward The shape of the active site changes because the non-competitive inhibitor has bound to an allosteric site; so preventing an enzyme-substrate complex from forming. Close Explanation
Forward The reaction rate cannot reach the same point because the non-competitive inhibitors have changed the shape of some of the active sites. Close Explanation