Download
1 / 22
220 likes | 338 Vues
The Once and Future Pulse of Colorado River Flow Mitigating Water Supply Risk Under Changing Climate. Balaji Rajagopalan Department of Civil, Environmental and Architectural Engineering And Cooperative Institute for Research in Environmental Sciences (CIRES) University of Colorado

E N D
The Once and Future Pulse of Colorado River FlowMitigating Water Supply Risk Under Changing Climate Balaji Rajagopalan Department of Civil, Environmental and Architectural Engineering And Cooperative Institute for Research in Environmental Sciences (CIRES) University of Colorado Boulder, CO 23 February, 2010 Presentation to Michael Kinter-Meyer Energy and Environment Directorate Pacific Northwest National Laboratory
Key Questions • What is the Colorado River System-wide Water supply risk profile under climate change? • Need to consider the entire syste (~60AF Storage) • Need to generate streamflow scenarios consistent with climate projections and combining (Paleo?) • Is there flexibility within the existing management framework? • Can Management Mitigate the future risk? Rajagopalan et al. (2009, WRR)
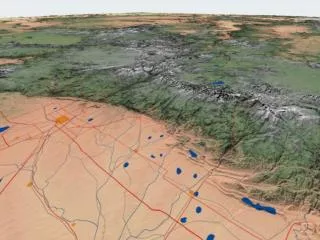
Colorado River Basin Overview 7 States, 2 Nations Upper Basin: CO, UT, WY, NM Lower Basin: AZ, CA, NV Fastest Growing Part of the U.S. Over 1,450 miles in length Basin makes up about 8% of total U.S. lands Highly variable Natural Flow which averages 15 MAF 60 MAF of total storage 4x Annual Flow 50 MAF in Powell + Mead Irrigates 3.5 million acres Serves 30 million people Very Complicated Legal Environment Denver, Albuquerque, Phoenix, Tucson, Las Vegas, Los Angeles, San Diego all use CRB water DOI Reclamation Operates Mead/Powell Source:Reclamation 1 acre-foot = 325,000 gals, 1 maf = 325 * 109 gals 1 maf = 1.23 km3 = 1.23*109 m3
UC CRSS stream gauges LC CRSS stream gauges Colorado River Demand - Supply
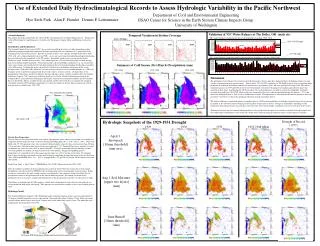
Below normal flows into Lake Powell 2000-2004 62%, 59%, 25%, 51%, 51%, respectively 2002 at 25% lowest inflow recorded since completion of Glen Canyon Dam Some relief in 2005 105% of normal inflows Not in 2006 ! 73% of normal inflows 2007 at 68% of Normal inflows 2008 at 111% of Normal inflows Recent conditions in the Colorado River BasinPaleo Context Colorado River at Lees Ferry, AZ 5 year running average
Winter and Summer Precipitation Changes at 2100 – High Emissions Summer Hatching Indicates Areas of Strong Model Agreement
Precipitation, Temperatures and Runoff in 2070-2099 CRB Runoff From C&L ~115% Triangle size proportional to runoff changes: Up = Increase Down = Decrease Green = 2010-2039 Blue = 2040-2069 Red = 2070-2099 -40% to +30% Runoff changes in 2070-2099 ~80% 2C to 6 C
Scale Matters 14.4% 16.1% 9.9% 24.9% 14.1% 6.3% 2.4% 11.8% % of Total Runoff • Runoff Efficiency (How much Precip actually runs off) Varies Greatly from ~5% (Dirty Devil) to > 40% (Upper Mainstem) • You can’t model the basin at large scales and expect accurate results • GCMs (e.g. Milly, Seager) and H&E 2006 may get the right answer, but miss important topographical effects
% Total Runoff Runoff Basin Area • Most runoff comes from small part of the basin > 9000 feet • Very Little of the Runoff Comes from Below 9000’ (16% Runoff, 87% of Area) • 84% of Total Runoff Comes from 13% of the Basin Area – all above 9000’
Future Flow Summary • Future projections of Climate/Hydrology in the basin based on current knowledge suggest • Increase in temperature with less uncertainty • Decrease in streamflow with large uncertainty • Uncertain about the summer rainfall (which forms a reasonable amount of flow) • Unreliable on the sequence of wet/dry (which is key for system risk/reliability) • The best information that can be used is the projected mean flow • Clearly, need to combine paleo + observed + projection to generate plausible flow scenarios
System Risk • Streamflow Simulation • Prairie et al. (2008) WRR • System Water Balance Model • Management Alternatives • (Reservoir Operation + Demand Growth) • Rajagopalan et al. (2009), WRR
Powell + Mead Water Balance Model: Our version Lees Ferry Natural Flow (15.0) + Intervening flows (0.8) - Upper Basin Consumptive Use (4.5+) Climate Change -20% LF flows over 50 years Evaporation (varies with stage; 1.4 avg declining to 1.1) LB Consumptive Use + MX Delivery + losses (9.6) “Bank Storage is near long-term equilibrium’ Initial Net Inflow = +0.4
Storage in any year is computed as: • Storage = Previous Storage + Inflow - ET- Demand • Upper and Lower Colorado Basin demand = 13.5 MAF/yr • Total Active Storage in the system 60 MAF reservoir • Initial storage of 30 MAF (i.e., current reservoir content) • Inflow values are natural flows at Lee’s Ferry, AZ + Intervening flows between Powell and Mead and below Mead • ET computed using Lake Area – Lake volume relationship and an average ET coefficient of 0.436 • Transmission Losses ~6% of Releases Water Balance Model
Flow and Demand Trendsapplied to the simulations Blue – mean flow trend 15MAF – 12MAF By 2057 -0.06MAF/year Under 20% - reduction Red – demand trend 13.5MAF – 14.1MAF by 2030
Management and Demand Growth Combinations Table 1 Descriptions of alternatives considered in this study. (LB = Lower Basin, MX = Mexico, UB = Upper Basin, DS = Delivery Shortage and S = Storage). Per EIS depletion schedule the total deliveries are projected to be 13.9 MaF by 2026 and 14.4 MaF by 2057. * One alternative with full initial storage (E) illustrates the effects of a full system.
Climate Change – 20% reduction Climate Change – 10% reduction
Shortage Volume Under Climate Change 10% Reduction 20% Reduction
Sensitivity to Initial Demand - 20% reduction Initial Demand – 13.5MaF Initial Demand – 12.7MaF Actual Average Consumption In the recent decade
Summary • Water supply risk (i.e., risk of drying) is small (< 5%) in the near term ~2026, for any climate variability (good news) • Risk increases dramatically by about 7 times in the three decades thereafter (bad news) • Risk increase is highly nonlinear • There is flexibility in the system that can be exploited to mitigate risk. • Considered alternatives provide ideas • Smart operating policies and demand growth strategies need to be instilled • Demand profiles are not rigid • Delayed action can be too little too late • Water supply risk occurs well before any ‘abrupt’ climate change – even under modest changes • Nonlinear response