Download
1 / 16
160 likes | 335 Vues
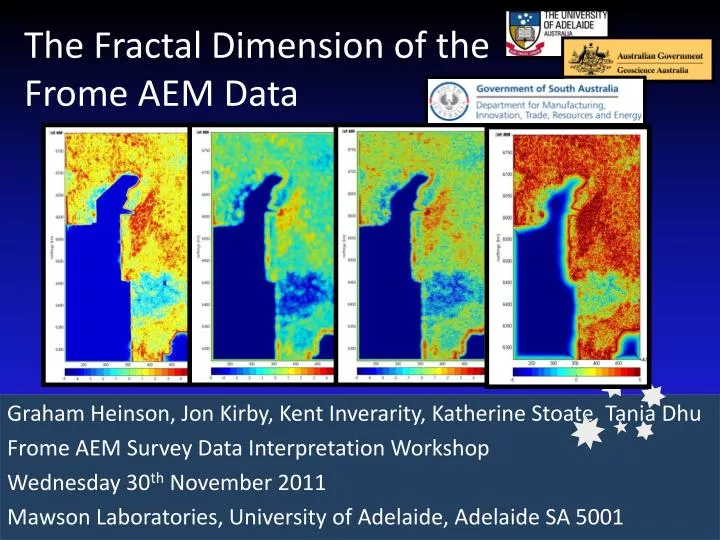
The Fractal Dimension of the Frome AEM Data. Graham Heinson, Jon Kirby, Kent Inverarity, Katherine Stoate, Tania Dhu Frome AEM Survey Data Interpretation Workshop Wednesday 30 th November 2011 Mawson Laboratories, University of Adelaide, Adelaide SA 5001. 40-60 m Conductivity slice.

E N D
The Fractal Dimension of the Frome AEM Data Graham Heinson, Jon Kirby, Kent Inverarity, Katherine Stoate, Tania Dhu Frome AEM Survey Data Interpretation Workshop Wednesday 30th November 2011 Mawson Laboratories, University of Adelaide, Adelaide SA 5001
“We show here that electromagnetic responses are fractal signals, reflecting a very rough distribution of electrical conductivity. Apparent conductivity profiles across a floodplain and a fractured sandstone aquifer both show that the fractal properties of the surface response depend on the complexity of the causative geological structure.”
Sandstones (heterogeneous) have greater slopes of power spectra than (well sorted) alluvial sediments
Many physical and geophysical phenomena are fractal in nature, such as topography and gravity field. These data have spectra with a power-law decay |k|-b, where |k| = kx2+ ky2 The slope of the power spectra is related to the fractal dimension by b = 8 - 2FD (or FD = 4- b/2)
Wavelet transform enables a ‘‘power spectrum’’ to be calculated at each and every location of a specified signal, i.e., power as a function of space and frequency Fourier power spectrum, yields power as a function only of frequency - spatial information has been lost Wavelets use localised basis functions, rather than infinitely repeating sines and cosines. Wavelet transform of a signal,g(x,y) is computed from the convolution of the signal with the complex conjugate of a wavelet, y(x,y) Wavelet Transform
Australian DEM (a), and its scalograms at 21 km scale, for (b) DoG, (c) Fan, (d) Halo, (e) Morlet, (f) Paul, (g) Perrier, and (h) Poisson wavelets. Grey-scale for scalograms is log10(power), from high (light) to low (dark) power.
What information is contained in the Frome AEM data set? • Preliminary study looked at the 40-60 m conductivity slice • Gridded at 0.625 km squares • Can wavelet analysis indicate variability in power and fractal scaling?
DoG Wavelet Scalogram Power contained in wavelet
DoG Wavelet at 10 km scale 40-60 m Conductivity Slice
DoG Fan Halo Morlet Perrier Poisson 40-60 m Conductivity Slice
Conclusion • Why might is be worth this analysis? • Power-spectra indicate localised change, edges • Differences between homogenous and heterogeneous Earth • Fractal dimension indicates spatial self similarity over different scale lengths (correlation with wavelengths) • Potentially link fractal dimension with geology (fractures, lithology, stratigraphy, groundwater, etc)