Download
1 / 28
300 likes | 593 Vues
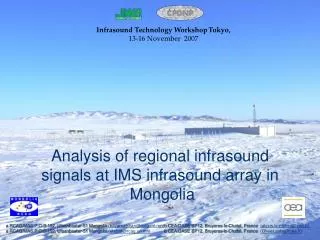
Infrasound Technology Workshop Tokyo, 13-16 November 2007. Analysis of regional infrasound signals at IMS infrasound array in Mongolia. a RCAG/MAS P.O.B-152, Ulaanbaatar-51 Mongolia (bayarsaikhan@rcag.url.mn) b CEA/DASE BP12, Bruyeres-le-Chatel, France (alexis.le-pichon@cea.fr)

E N D
Infrasound Technology WorkshopTokyo, 13-16 November 2007 Analysis of regional infrasound signals at IMS infrasound array in Mongolia a RCAG/MAS P.O.B-152, Ulaanbaatar-51Mongolia (bayarsaikhan@rcag.url.mn)b CEA/DASE BP12, Bruyeres-le-Chatel, France (alexis.le-pichon@cea.fr) a RCAG/MAS P.O.B-152, Ulaanbaatar-51Mongolia(ulzibat@rcag.url.mn)b CEA/DASE BP12, Bruyeres-le-Chatel, France (Olivier.sebe@cea.fr)
ITW2007 Tokyo,13-16 November 2007 Content • Description of mining explosions around I34MN • Seismo-acoustic data analysis: Erdenet Copper mining explosion Baganuur Coal mining explosion • Infrasound and seismic signal measurement • Data processing and analysis • Infrasound wave propagation characteristics • Conclusion
ITW2007 Tokyo,13-16 November 2007 Explosion sites and recording stations Erdenet mining Mining area Ulaanbaatar PS25 I34MN Baganuur mining Mining area Infrasound array Mining Seismic array
ITW2007 Tokyo,13-16 November 2007 Statistics analysis of quarry blast Detected mining explosions between 2000 and 2005 Recorded at seismic PS25 stations and analyzed by seismic data Recorded at infrasound I34MN stations and analyzed by PMCC automatic bulletin
ITW2007 Tokyo,13-16 November 2007 Erdenet copper mine 3070-3080 Baganuur coal mine 930-940 Detected infrasonic signals between 2000-2005 All detected infrasound signals as a function of time and azimuth (left histogram shows number of detected events)
ITW2007 Tokyo,13-16 November 2007 Characteristics of selected mining areas In the Erdenet area, explosions occur once a week on each Friday - Distance relative to the I34MN station ~ 216 km - Scheduled explosions each week at 07-08 UTM - Magnitude range – 2.0 – 2.5 The Baganuur mine makes series of explosions every week - Distance relative to the I34MN station ~ 143 km - Scheduled explosions every week at 02-12 UTM - Magnitude range – 2.0 – 2.5
ITW2007 Tokyo,13-16 November 2007 Relocated events, an input for a new interpretation Relocation results: explosions from the Baganuur and Erdenet mining sites were reviewed and relocated by combination of seismic and infrasound phase arrivals.
ITW2007 Tokyo,13-16 November 2007 Seismic and infrasound recordings from Erdenet copper mine Seismo-acoustic ~11 min Winter time (09 Jan 2004 07:09:33.77 )
ITW2007 Tokyo,13-16 November 2007 Seismo-acoustic ~11 min Summer time (30 July 2004 05:47:31.27 )
ITW2007 Tokyo,13-16 November 2007 Iw Examples of PMCC analysis Infrasound recordings I34MN: 216 km Duration: 32 sec Nb of phase: 2 Winter time Displays the distribution of detection according in a Speed/Back Azimuths radar plot (Erdenet) Iw Is Summer time Detailed processing of data is done manually using PMCC results of Erdenet
ITW2007 Tokyo,13-16 November 2007 Seismic and infrasound recordings Baganuur coal mine Seismo-acoustic ~8 min The detected of winter time (13 Jan 2003 06:30:26.65)
ITW2007 Tokyo,13-16 November 2007 The detected of summer time (13 Jan 2003 06:30:26.65)
ITW2007 Tokyo,13-16 November 2007 Iw Iw Examples of PMCC analysis Infrasound recordings I34MN: 143 km Duration: 30 sec Nb of phase: 1 Winter time Displays the distribution of detection according in a Speed/Back Azimuths radar plot (Baganuur) Summer time Detailed processing of data is done manually using PMCC results of Baganuur
ITW2007 Tokyo,13-16 November 2007 SEISMO-ACOUSTIC DATA ANALYSIS Travel time distribution by distance, red circles correspond to Baganuur and blue circles are Erdenet Number of quarry blast used for analysis
ITW2007 Tokyo,13-16 November 2007 Distribution travel time by azimuth Graphics of travel times Vs azimuth of Erdenet mining explosions ( Red circles are showing - Summer time Blue are winter time) Graphics of travel times Vsazimuth of Baganuur mining explosions ( Red circles are showing - Summer time Blue are winter time)
ITW2007 Tokyo,13-16 November 2007 Iw Is Is Distribution of celerity by month, green and blue dot are manual measurement data of Baganuur and Erdenet, pink and red squares are mean of all data Distribution of travel time by Julian date, red circle are Baganuur explosion and black circle are Erdenet We compared all manual measurements of infrasound data from Erdenet and Baganuur mining sites by month and by travel time and date. The observed variation of about 100 seconds is mainly due to seasonal dependence of atmospheric wind characteristics.
ITW2007 Tokyo,13-16 November 2007 CONCLUSION • Many seismic and infrasonic signals are observed daily. Nearly a quarter of all seismic signals has associated infrasonic arrivals. Most of them occur during local working hours. These observations suggest that a great deal of the activity observed is man-made. Many of the seismo-acoustic signals are located in the distance range of 40 to 500 km from the IS34MN array. The efficiency of the detection of these man-made seismo-acoustic events is largely dependent on the regional infrasound propagation conditions related to the sound velocity, the epicentral as well as the wind force and direction. • Additional work is needed in the interpretation and modeling of seismic and infrasound signals.
Conclusion • The seasonal dependence of travel time is mainly controlled by seasonal variations of atmospheric wind force and direction. The seasonal temperature variation has almost no effect.
Infrasound –ûí í¿¿äëèéí ñòàíöûã áîãèíî õóãàöààãààð ñóóðèëëóóëààä source-óóäûã òîäîðõîéëîõ áîëîìæûí òàëààð (determine source of detection natural and some noise
Question • Continues work data analysis • Ýäãýýð ¿ð ä¿íãýýð….