Download
1 / 37
370 likes | 623 Vues
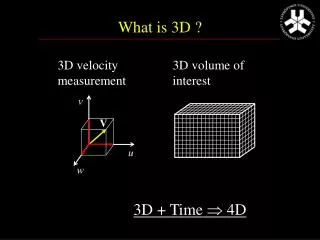
v. V. u. w. What is 3D ?. 3D velocity measurement. 3D volume of interest. 3D + Time 4D. 3D Doppler Ultrasound. 3D region, but only one velocity component. MRI @ 1,5T. 2D MRI Phase Contrast. Vector display of MRI phase contrast data. Early diastole. Systole. v. V. u. w.

E N D
v V u w What is 3D ? 3D velocity measurement 3D volume of interest 3D + Time 4D
3D Doppler Ultrasound 3D region, but only one velocity component
2D MRI Phase Contrast Vector display of MRI phase contrast data Early diastole Systole
v V u w 3D Cine Phase Contrast 3D Velocity dataset 2D Slices Wigström et al, Magn Reson Med, 1996;36(5)
Visualization of 3D Velocity Data Color coding Vector plot
v2Dt v3Dt v4Dt LVOT v1Dt v5Dt v6Dt Apex LA Particle Trace Visualization Integration of the velocity field starting in a user specified timeframe and at a specified location Wigström et al, Magn Reson Med, 1999;41(4)
LVOT LVOT LA LA LV LV LV Diastolic Filling Early filling (E) Late filling (A) Fyrenius, et al, J Am Soc Echocardiogr, 1999,12:817-21
LVOT LA LV LV Diastolic Flow Patterns Vortices behind the mitral leaflets Doppler MRI
Right PV Level of mitral valve Level of mitral valve Left PV Vortical flow in the left atrium A. Fyrenius
Automatisk virvelkvantifiering Hur ser en virvel ut?
Automatisk virvelkvantifiering Hur ser en virvel ut? • Begränsad geometri • “spiralflöde” etc
Att hitta virvel kärnor • Utgå från ett önskat “mönster” • Leta igenom hela volymen efter matchande områden
Andra flödesstrukturer • Parallell-flöde • “Skruv-flöde” Exempel: Aorta
Pressure differences Simplified Bernoulli: Only for stenotic flow at peak inflow Navier-Stokes: More general, but time-resolved 3D velocity field needed
0.6 Aortic Pressure Differences Maximum velocity [m/s] 2 1.5 1 0.5 Level of coarctation repair 0 -0.6 -0.4 -0.2 0 0.2 0.4 Time [s] Pressure difference [mmHg] 0 -5 Normal -10 -15 Repaired coarctation -0.6 -0.4 -0.2 0 0.2 0.4 0.6 Time [s]
Early Diastole Beginning Peak End Left Atrium Left Ventricular Outflow Tract Left Ventricle
Left Atrium Left Ventricular Outflow Tract Left Ventricle Apex Late Diastole
Myocardial Velocity LA Early diastole Short axis LV Long axis
Myocardial Velocities in 3D Different directions acrossthe wall in early diastole
Myocardial Velocities in 3D Longitudinal Radial Circumferential Velocity [cm/s] BaseMidApex Kvitting, et. al., ESMRMB 2000
Translation Rotation Strain Shear-Strain = + + + Passive motion Strain Analysis of 3D Velocity Data • Strain • Strain rate • Stress - strain relationship ?
Strain Rate 1D: 2D: 3D:
E S A Strain rate [1/s] [s] Longitudinal expansion Radial expansion Strain rate (maximum eigenvalue) P. Selskog
Vad kan 3D ultraljud tillföra? • Volymsberäkningar
Vad kan 3D ultraljud tillföra? • Anatomiska relationer